It’s time for our annual look at population changes in Denver and other counties throughout Colorado. Use these links for previous years: 2014 | 2013 | 2010
For the sixth time in the past seven years, Denver County has led the state in numeric population growth, according to the US Census Bureau. The Census Bureau’s recently released 2014 population estimates show that Denver County (the City and County of Denver) had a population of 663,862 on July 1, 2014, an increase of 15,461 over their July 2013 estimate. Denver’s 2010 Census population count was 600,158.
Here are two tables I’ve prepared showing the “Vintage 2014” postcensal estimates for the Top 10 Colorado counties in both numeric and percentage population gain between 2013 and 2014 (click to embiggen):
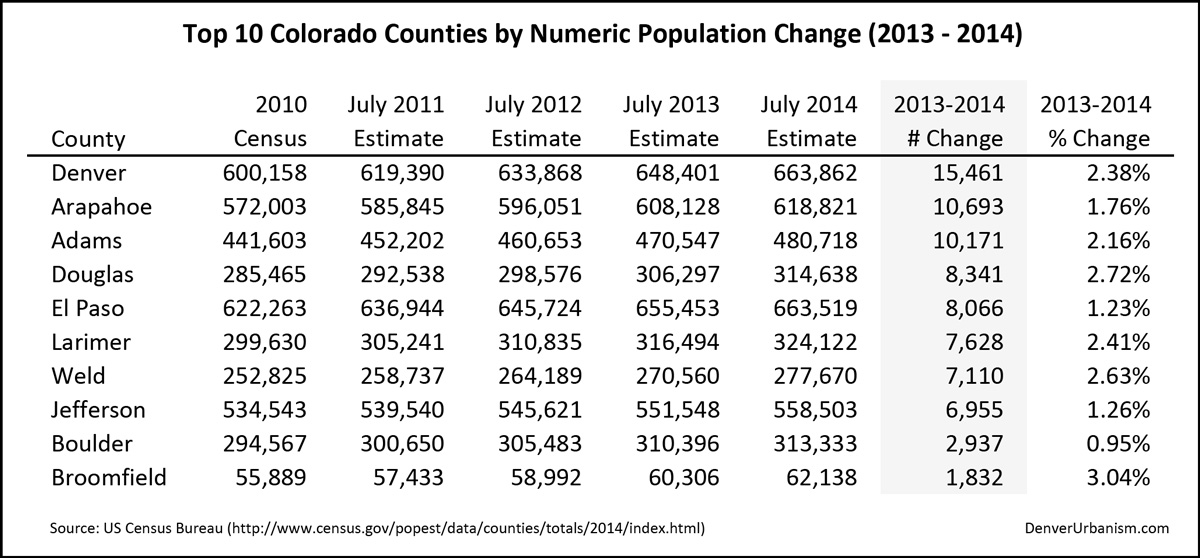
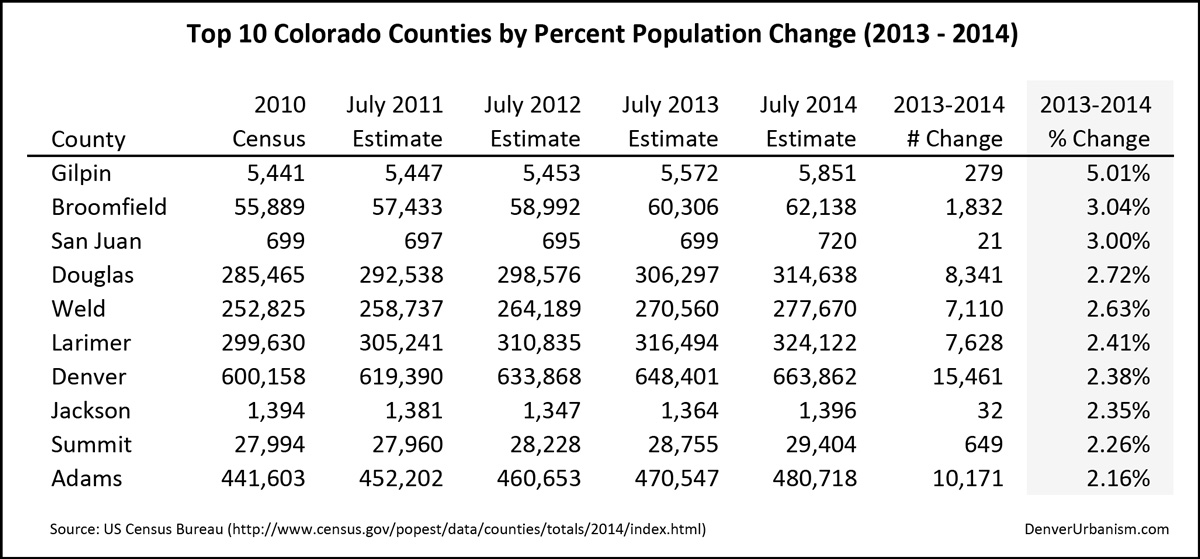
As you can see, Denver led the state with a gain of 15,461 and was in the Top 10 by percentage change with a respectable 2.38% increase. Denver also regained the title of the most populous county in Colorado, passing up El Paso County by 343 people. El Paso overtook Denver in 2004 and held a 22,105 advantage in 2010. The first table also reveals another interesting fact: Douglas County just passed up Boulder County in population.
Let’s take a look at the Top 10 Colorado counties in both numeric and percentage population gain between the 2010 Census and the new July 2014 estimates:
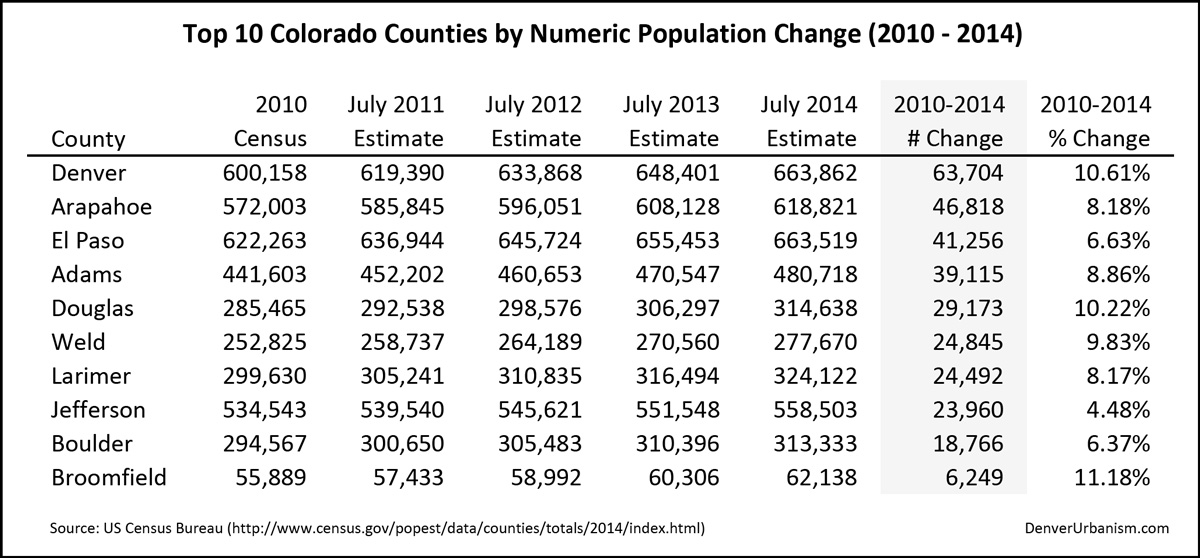
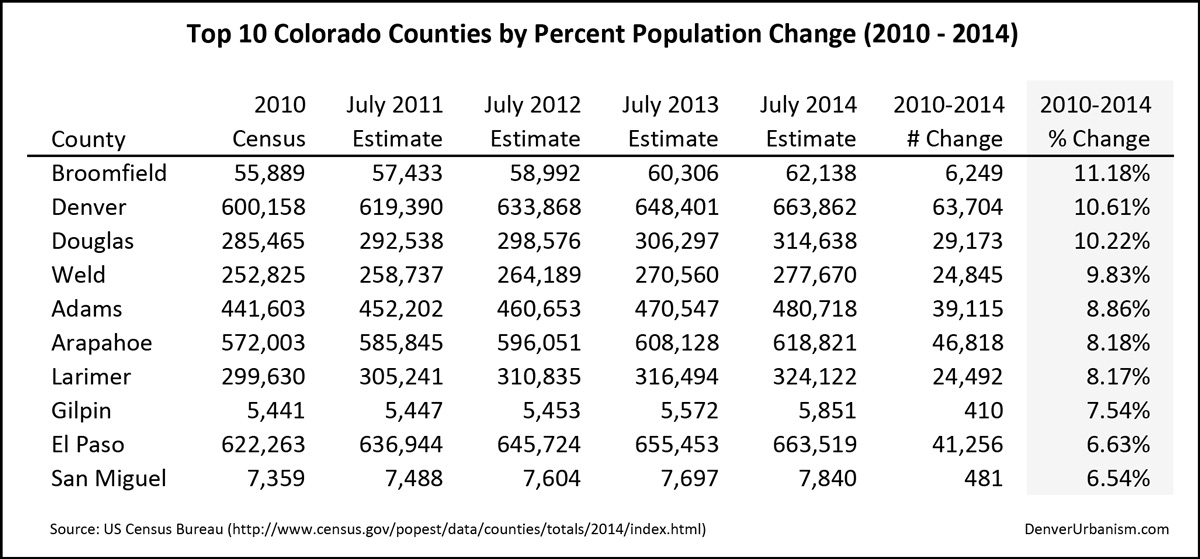
Denver’s gain of 63,704 people since the 2010 Census easily surpasses the city’s entire population increase of 45,522 between the 2000 (554,636) and 2010 (600,158) Census counts, with six more years still to go before the 2020 Census. At this pace, Denver is likely to easily pass the 700,000 mark and could close in on 750,000. The Colorado State Demographer’s October 2014 forecast for Denver’s population in 2020 is 732,085.
Here are two additional analyses I’d like to share with you that focus on just the seven-county Denver/Boulder metro area (Adams, Arapahoe, Boulder, Broomfield, Denver, Douglas, and Jefferson counties). The first set of tables show the population counts and estimates from 2010 through 2014 for these seven metro counties, followed by a column percent-of-total table showing each county’s percent of the metro area total population for each of the five time periods:
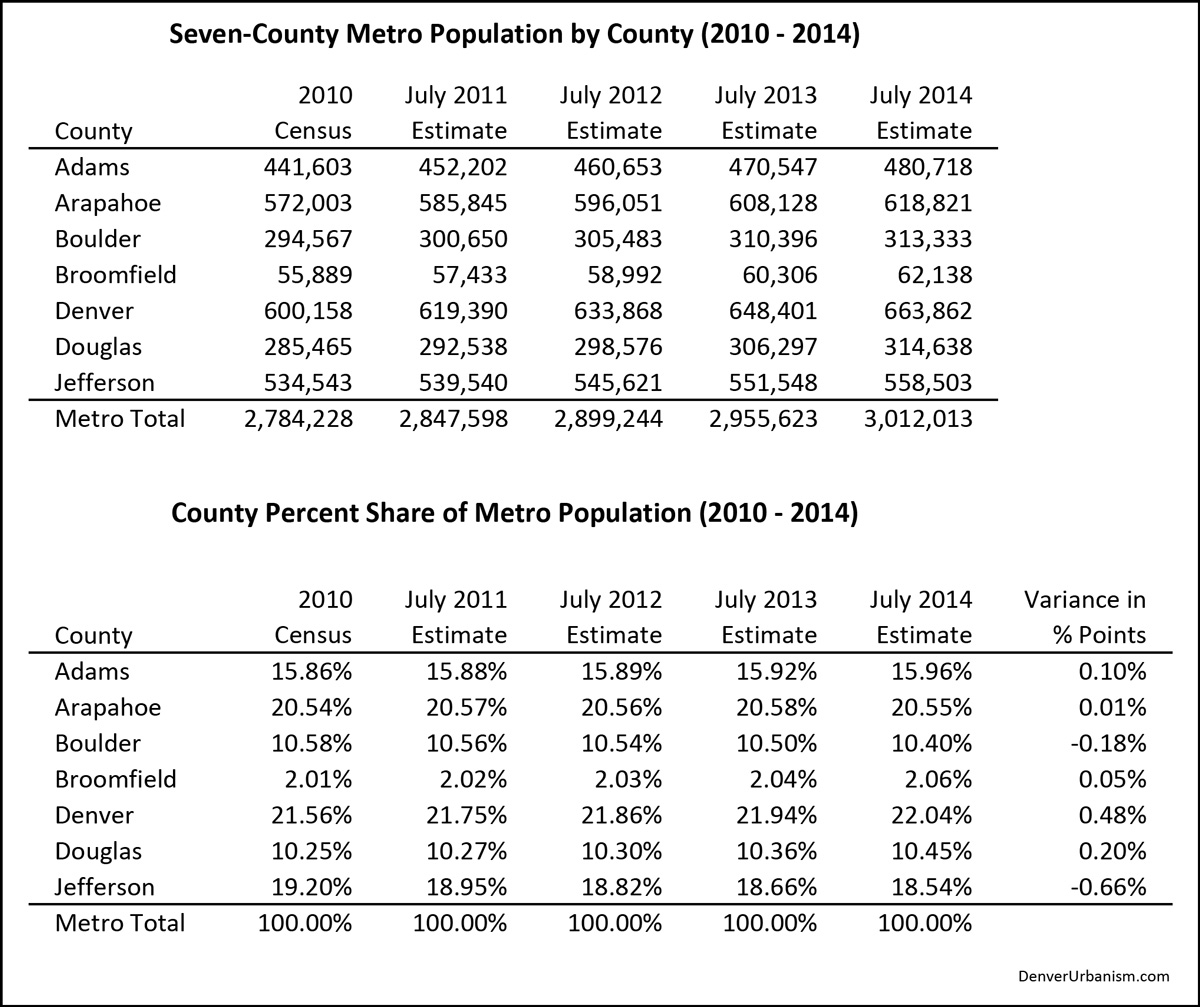
The far right column in the percentage table shows each county’s variance (in absolute percentage points) of share of metro population between 2010 and 2014. Denver began the decade with a 21.56% share, and that has increased by 2014 to 22.04%. While the increase is slight, it is notable considering that Denver’s share of the metro area population has been decreasing since the 1930s and this represents a reversal of that trend. Arapahoe’s percent share has stayed mostly flat, while Adams, Broomfield and Douglas counties have seen small increases. Boulder’s share has dropped slightly, with Jefferson County seeing the largest decrease of 0.66% percentage points. Also note that the total population for the seven Denver/Boulder metro area counties passed the 3 million mark for the first time.
The second analysis compares each county’s percent of metro area population growth from 2013-2014 to its share of the metro area population. If growth were proportionally distributed across the metro area, each county’s percent share of growth from 2013 to 2014 (its “growth capture rate”) would be the same as its share of metro population. Let’s take a look:
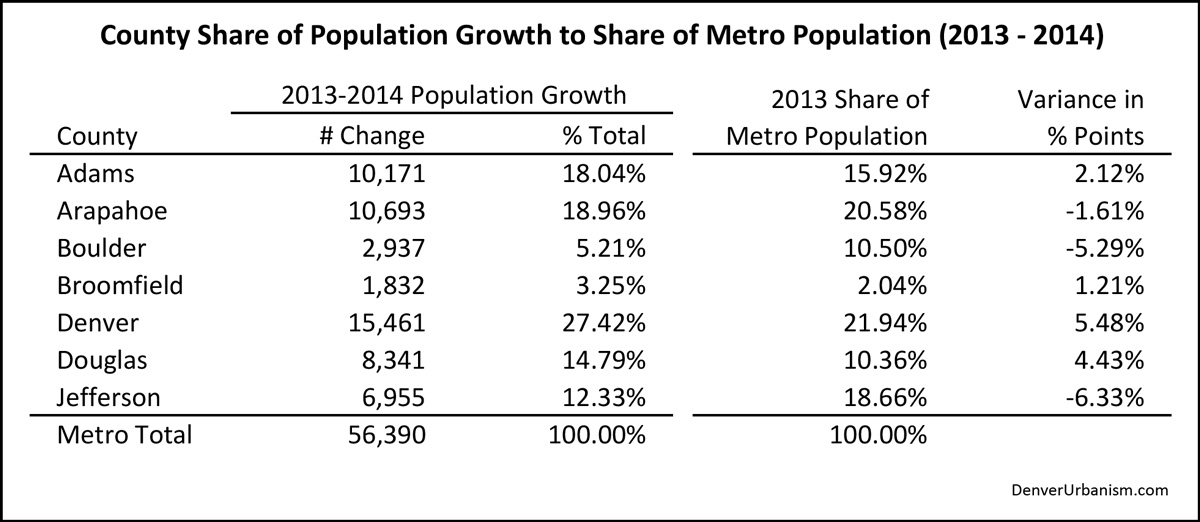
The columns on the left show the numeric population changes for the seven counties between 2013 and 2014 and the percent each county captured of the metro total increase of 56,390. The next column to the right shows each county’s share of the metro population at the beginning of this time period (2013). The rightmost column compares these two percentages by calculating the absolute difference in percentage points. Denver’s 27.42% share of 2013-2014 metro growth is 5.48 percentage points higher than its proportional share of the metro population, indicating that Denver over-captured in population growth during the time period. Douglas, Adams, and Broomfield also grew more than their relative shares by a few percentage points. Arapahoe was down slightly, with Boulder and Jefferson counties significantly under-capturing their proportional share of metro area growth.
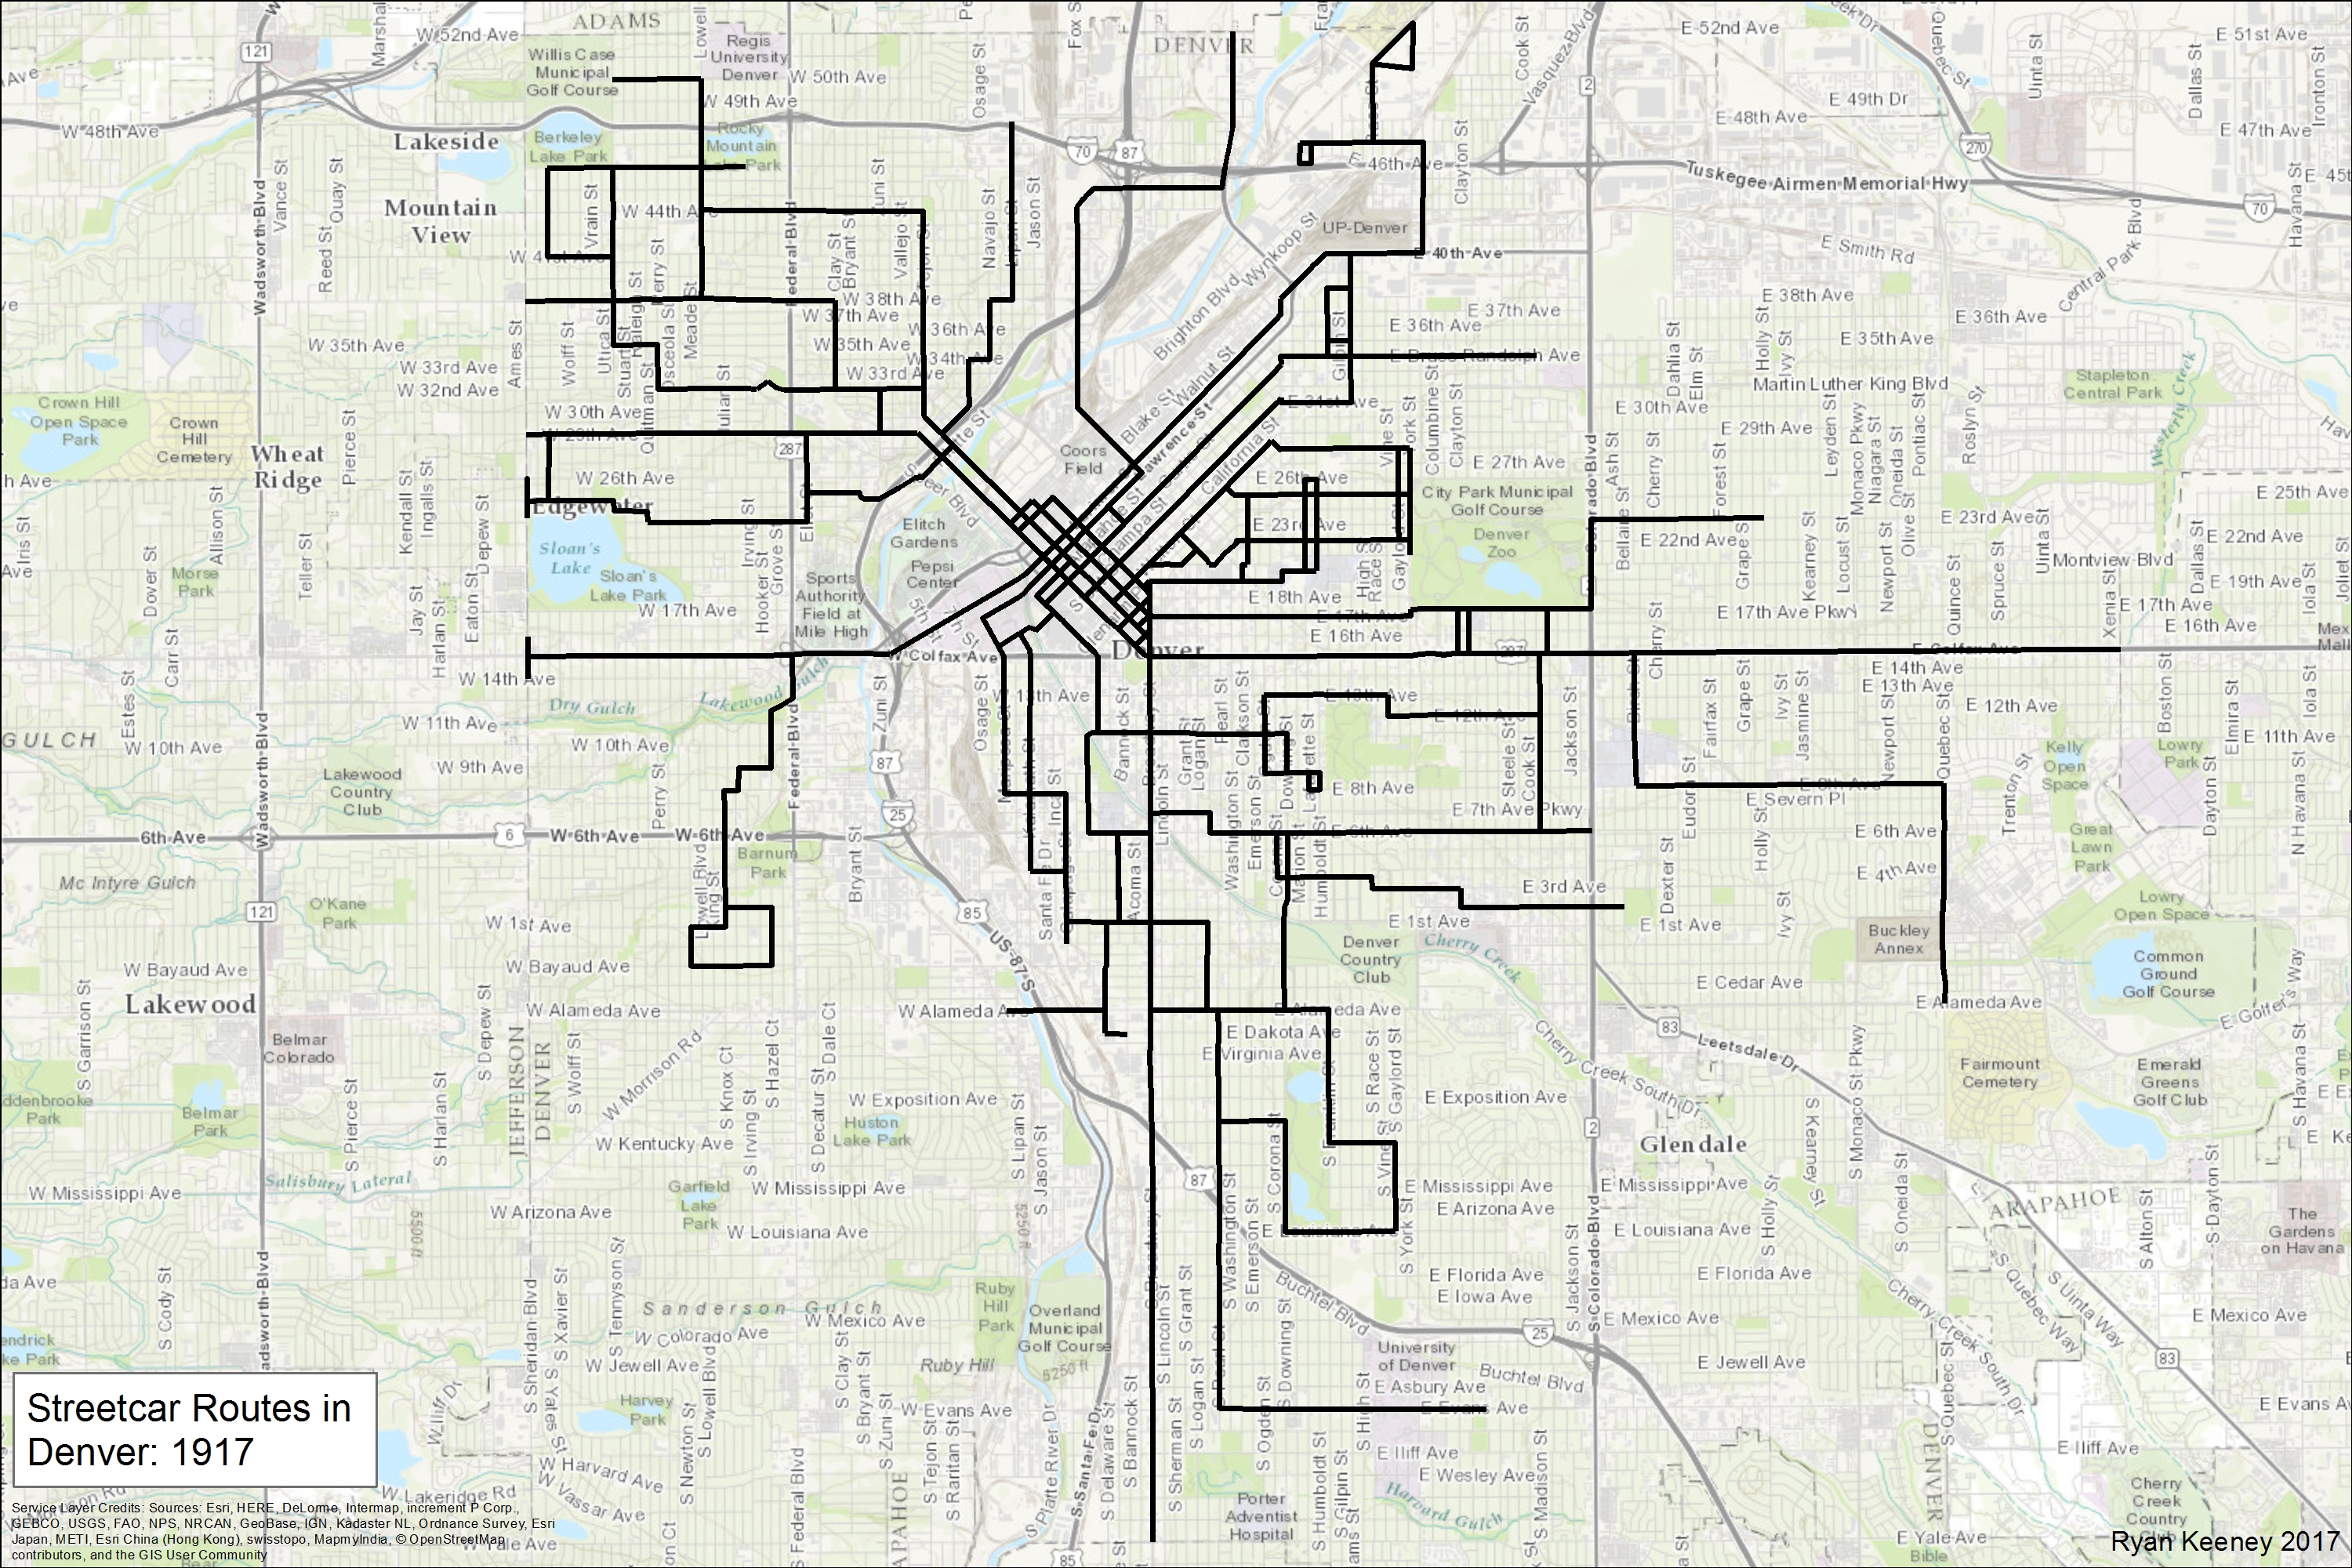
With landlocked Denver likely to continue to grow at a steady pace for the foreseeable future, infill development, higher-density development, transit-oriented development, and significant investment in bicycle, pedestrian, and transit infrastructure are absolutely critical to ensure we grow in a smart, sustainable manner.


Hey Ken, great post. Thanks for putting this together. It reminded me of an idle question I’ve had for a while now: do you know when and why Denver and Boulder became separate MSA’s? I’ve done a bit of googling and haven’t yet found an answer, much less a satisfying one.
It’s the Dept. of Commerce that actually determines the MSAs and CSAs and it’s based on the percent of commuters going between the communities. If more people lived in Boulder and commuted to Denver and vice versa, it could push the percentage high enough to cause Denver-Boulder into a single MSA. Locally—despite the federal government’s definitions—Boulder has always been included as part of the metro area, so for my purposes in looking at population, I include them. Interestingly, the Denver CSA, which includes Boulder, also includes a lot of additional counties that generally aren’t considered locally to be part of the metro area; Weld County being a good example. In order to pick up the communities along I-25 like Erie, Firestone, Frederick, which clearly are part of the metro area, we also have to take Greeley along with them, which doesn’t make much sense. So the Denver MSA (without Boulder) under-represents the metro area, and the Denver CSA over-represents the metro area. But, if you’re willing to do a little math, you can tally the counties you want like I’ve done to come up with numbers that represent more closely the definition of the “Denver-Boulder” metro area we use locally.
Interesting. I hadn’t thought about it as a matter of MSA definition and didn’t realize that definition was tied to percent commuting, but it makes a lot of sense. Thanks, Ken.
This will have interesting political implications I think for the 2020 census. First off, Denver definitely needs to have its own congressional district. The average congressional district population is 710,000, so Denver definitely will be getting its own (CO-1 includes Denver and parts of Jefferson and Arapahoe counties). With this growth, I think Colorado (the state demographer is estimating 6 million by 2020) is going to get another congressional district and clearly that district is going to be in Metro Denver. Maybe just have one for each direction: Western/northwestern, northern/eastern and southern suburbs. And probably CO-2 needs to just be Boulder and Ft. Collins, shedding it’s mountain communities to CO-3. It’s definitely looking like Colorado will have 8 congressional districts, with four of them (maybe even five) being all or mostly just the Metro area.