Many people, even some longtime residents of the city, would be surprised learn that Denver once had a world-class public transportation system in the form of streetcars. These street railways existed for 78 years of the city’s history and once densely covered a large portion of the modern city proper. Below is a map (source) of the system in 1913.

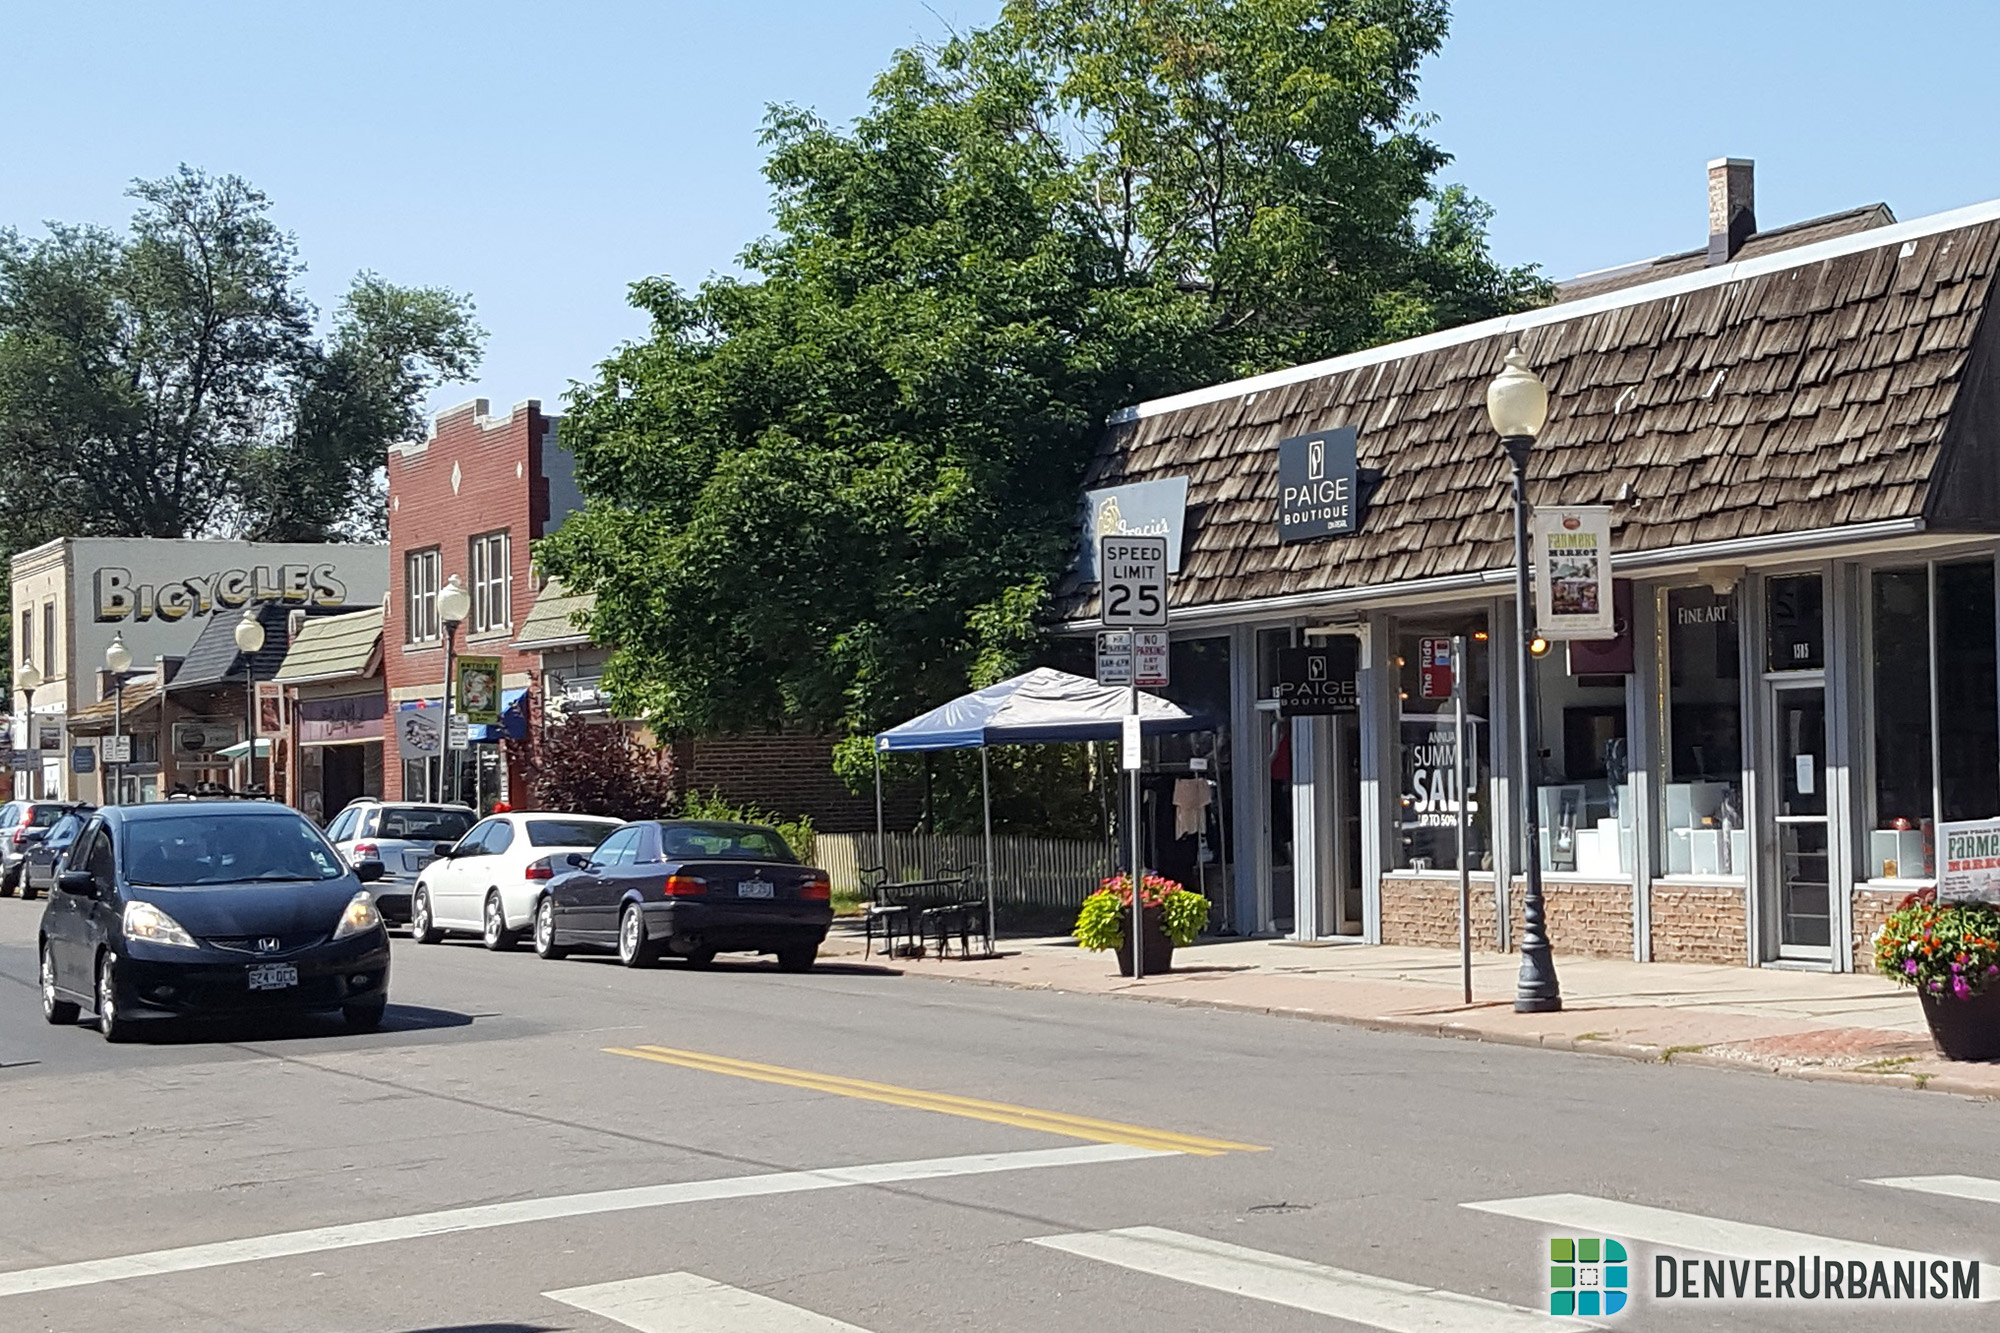
Although long gone today, evidence abounds of the streetcar’s presence in the city, mainly in the form of old commercial strips lining arterials like Colfax and Broadway, and embedded in neighborhoods on streets like South Pearl (below left) and Tennyson. This legacy in the built environment is not only valuable for its history and aesthetic. It also contributes to the walkability of Denver’s neighborhoods. Because these developments are scattered in close proximity to residences, more people are within walking distance to many types of businesses and services than they would otherwise be, as seen in the map (below right) of northwest Denver.

As a master’s student studying GIS (geographic information science) at the University of Denver, I recently completed a capstone project that focuses on this subject matter. Over the next couple of weeks, I will post several articles about the results of this project and the interactive web mapping application that I built for it. For this first post, I provide some background on how I came to focus on this topic for my master’s capstone…
I left car-dependent suburban Indianapolis where I grew up to attend graduate school here in Denver. I had a vague idea to use GIS to study something relating to urban sustainability, but I wasn’t sure what exactly. So I delved into the academic literature and soon came upon the subject matter that has become my driving passion to the present day: the negative externalities of cars and the role that the urban built environment plays in influencing our transportation mode choices.
I learned that the sprawling development patterns of most American cities (see Google image below), with their low densities, segregated land uses, and poor pedestrian design are directly responsible for the vast majority of Americans needing to drive everywhere. This has resulted in many very poor outcomes for the well-being of our urban communities. Over 35,000 people died in car accidents and over 2 million were injured in 2015, resulting in an annual economic impact of over 200 billion dollars in medical costs and property damage. Cars are also implicated in our outrageous obesity rates because they facilitate inactive lifestyles, their tailpipes spew pollution and contribute to global climate change, they cause tremendous noise pollution, and they erode community social capital by preventing social encounters in the public domain.

Urban municipalities all over the country, including Denver have recognized this and have set goals to reduce our excessive level of automobile dependency. After exploring various potential directions that I could take based on the academic literature that deals with these issues, I decided to change paths and seek a client for my project instead. I found a planner at Denver’s Community Planning and Development department named Andrew Rutz who was interested in working with students. He was curious about the pleasant, pedestrian friendly commercial corridors I mentioned earlier and having me do a GIS project around that. I really liked the idea and ran with it.
I proposed to focus on three related themes: the actual streetcar routes, the legacy of the streetcar in the built environment, and the impact of that legacy on neighborhood walkability. I planned to do a great deal of GIS digitization and analysis on these topics, and then host the results on an interactive web mapping application, viewable to the public, called an ESRI Story Map.
In the upcoming posts, I am going to delve into each of these three related concepts. By clicking on the link below, you can open the Story Map application. A map dominates the right side of the screen, and a sidebar is present on the left. The sidebar has three sections that control the content of the map. Under each section header are text and pictures that explain the map under consideration.
Please view the Story Map .
Below is a quick summary of each section:
- Streetcar Routes: This section displays every streetcar route that ever existed in the city of Denver. By using the time slider, you can see how the network was configured year-by-year, from the first horsecar line in 1872 to the last streetcar lines in 1950.
- Streetcar Legacy: This section maps every Streetcar Neighborhood Commercial Development, a concept of my own devising, in the modern city of Denver.
- Streetcar Neighborhood Walkability: This takes a look at a northwest Denver neighborhood to see how Streetcar Neighborhood Commercial Developments impact the ability of residents to access their day to day destinations on foot.


For this introductory post, I will just leave the application here for you to explore on your own. In the next three posts, I will delve into each section in more detail and explain why any of this matters. Next up will be the Streetcar Routes.
~~~
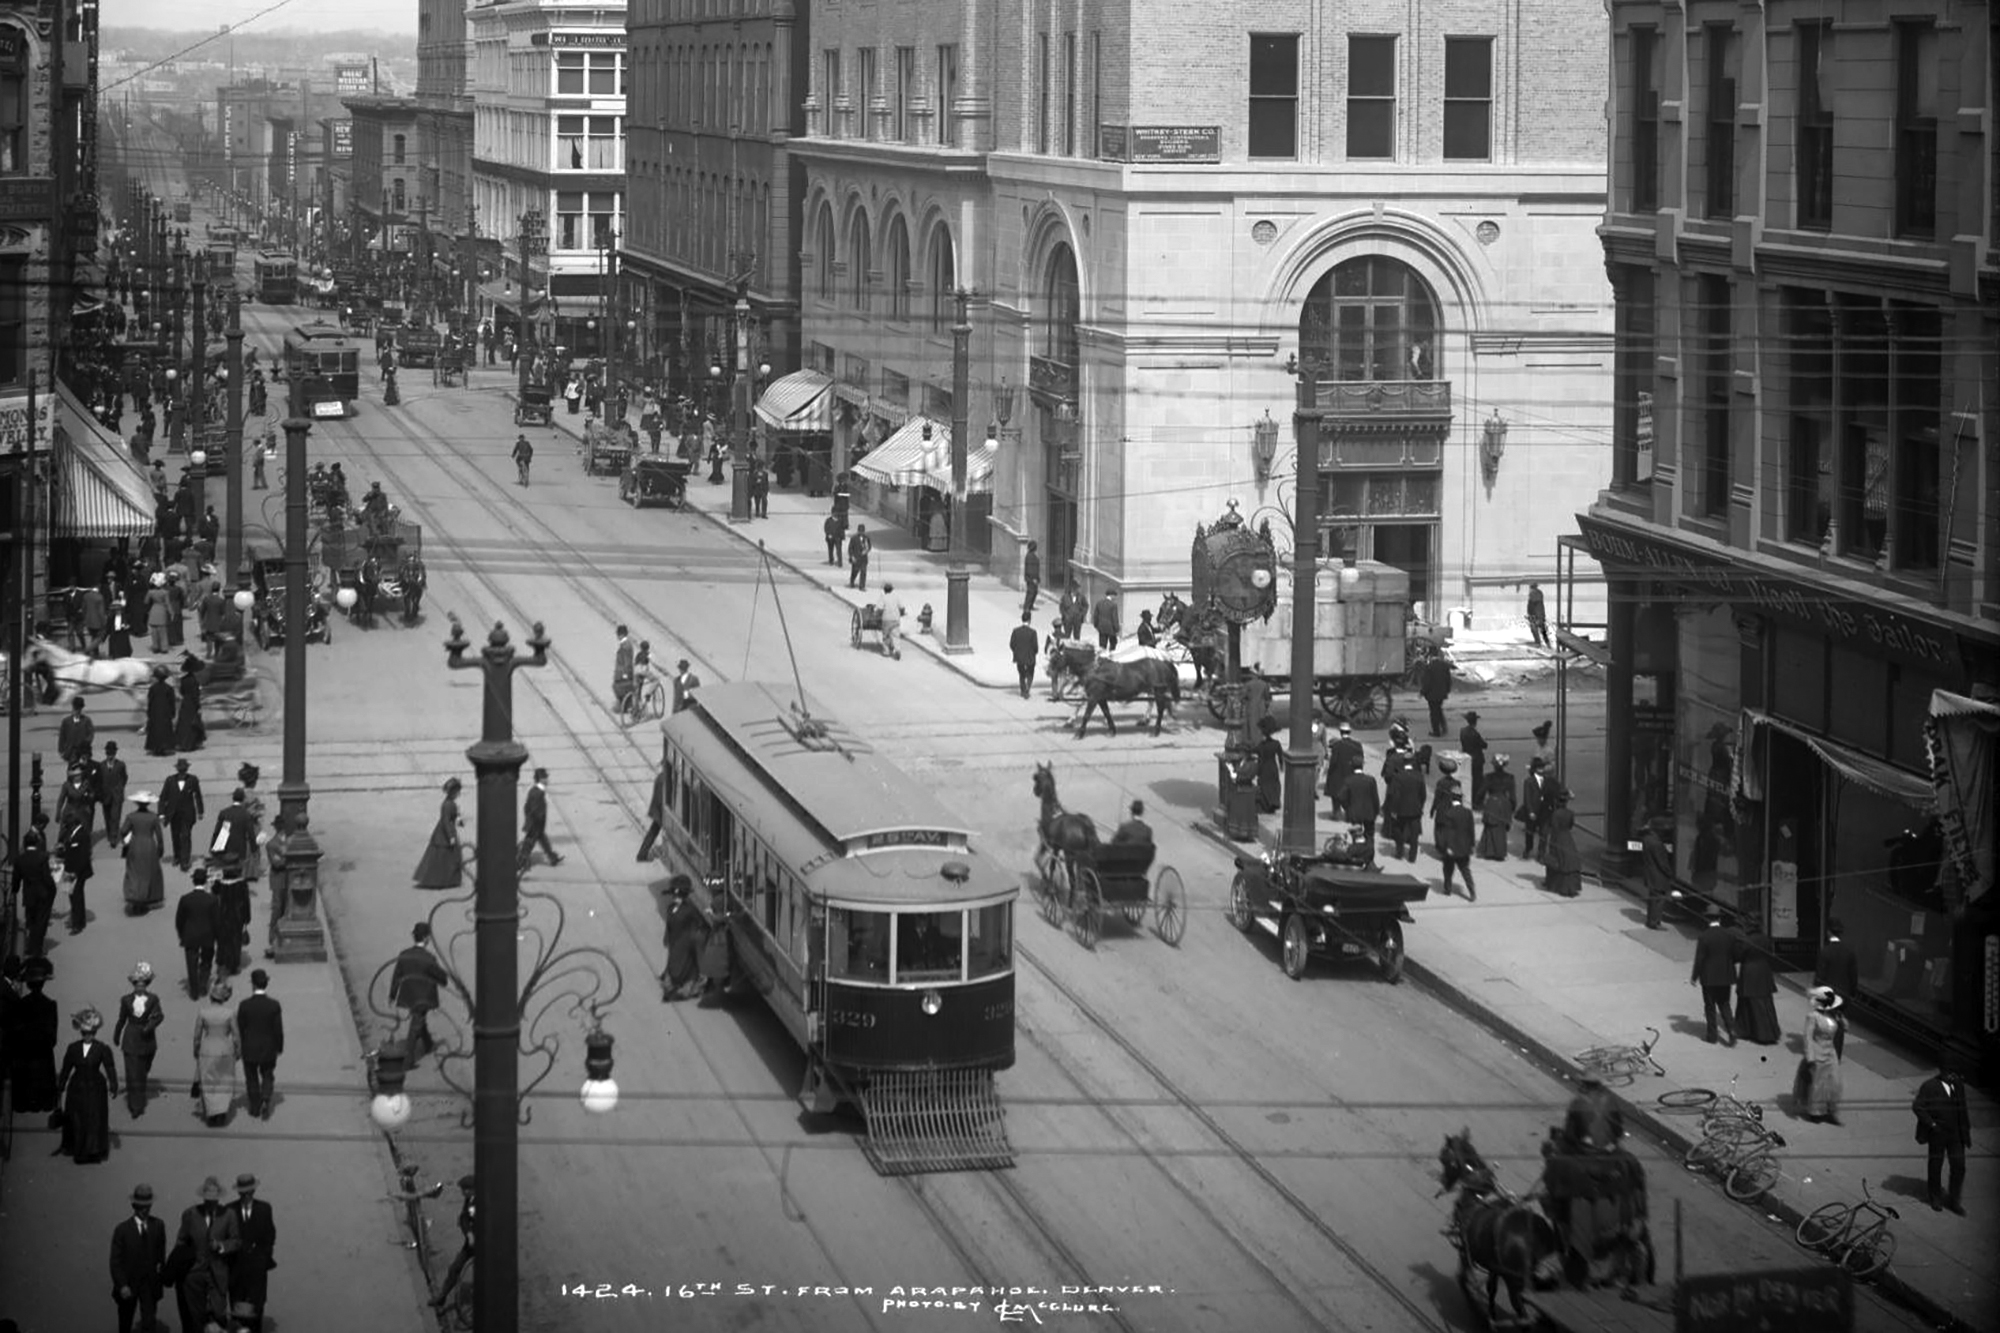
Featured image at top, courtesy of Denver Public Library Digital Collections. View of 16th and Arapahoe (1911). Source.


Very interesting post and capstone project. How can we bring back the street cars?!
Very cool!!
This looks great – very informative, I can’t wait to read more! Was there any part of your analysis that looked at old/modified streetcar routes that could be viable candidates for service restoration in a modern streetcar-style system?
Excellent visual piece, Ryan. This takes me back to growing up in Lakewood, our suburban house just a block from where the streetcar stopped, at about West 13th and Kipling. My dad rode the “Yellow Dragon” to work downtown, as a walker, back in the Forties. Later, our social status changed, when he bought a new Buick. Car ownership replaed the “value” of driving — but Dad remained a big fan of streetcars, as a truly viable option to traffic congestion and the pleasure of sidewalk life for our family, as real lovers of urban trains, in London, Paris and New York. Denver CAN HAVE a streetcar system, and your story is so on-track! Keep up the good work, Ryan.
Hey urbanists, take a look at the photo above: 16th and Arapahoe, `1911. It looks virtually unchanged from that time, with the same elegant office buildings, the busy sidewalk, the streetcars, powered by overhead electrical lines. But WHAT ELSE? Horses and buggies. A few vintage cars and trucks. In a hundred years since this picture, the buildings remain,, but the most basic mode of transportation is transformed, from horse-drawn vehicles. Denver is still A CITY, like so many. But getting around here is so different now. Riding, walking, driving. How much has the the basic mentallity of WHERE I AM changed, because of mobility?
One other thing about the old photo: the BIKES laying against the curb. A centrry ago, s viable way to get around, with or without cars or horse power.
Great info and Pix! Please consider (overhead) PRT as an alternative to streetcar re-introduction More info here: https://www.facebook.com/groups/Personal.Rapid.Transit/ I hope we can chat to dicuss more, thx Michael Maclauchlan [email protected]
Fantastic start to this great story. I can’t wait to see Denver evolve into a 21st century city centered around people and not cars and learning from the past.
Fascinating post and capstone project – I’m looking forward to continuing the posts and discussion.
If you have time, consider taking your research in a related direction to neighborhood walkability and look at the crash records for your SNCDs. The City/County has a Vision Zero dashboard that depicts crash records across the city for the last several years and can be broken down by type: https://www.denvergov.org/content/denvergov/en/transportation-mobility/vision-zero/dashboard.html
A quick look suggests that the most walkable SNCDs also correlate with low crash rates (even wide higher-speed Santa Fe Dr) as you’d expect.
The Old Spaghetti Factory downtown is in the old street car hub building. It’s worth a trip to inspect the architecture.