Denver’s Historic Streetcar Legacy
by Ryan Keeney
In August 2017, DenverUrbanism published a four-post series by contributor Ryan Keeney on the history of Denver’s historic streetcar routes and their lasting impact on the modern city: Denver’s Streetcar Legacy and Its Role in Neighborhood Walkability, The History of Denver’s Streetcars and Their Routes, The Legacy that Denver’s Streetcars Left Behind in the Modern City, and How Historic Streetcars Made the Denver of Today More Walkable. For our readers’ convenience, all four posts are presented below as chapters in a single narrative.
CHAPTER 1: DENVER’S STREETCAR LEGACY AND ITS ROLE IN NEIGHBORHOOD WALKABILITY
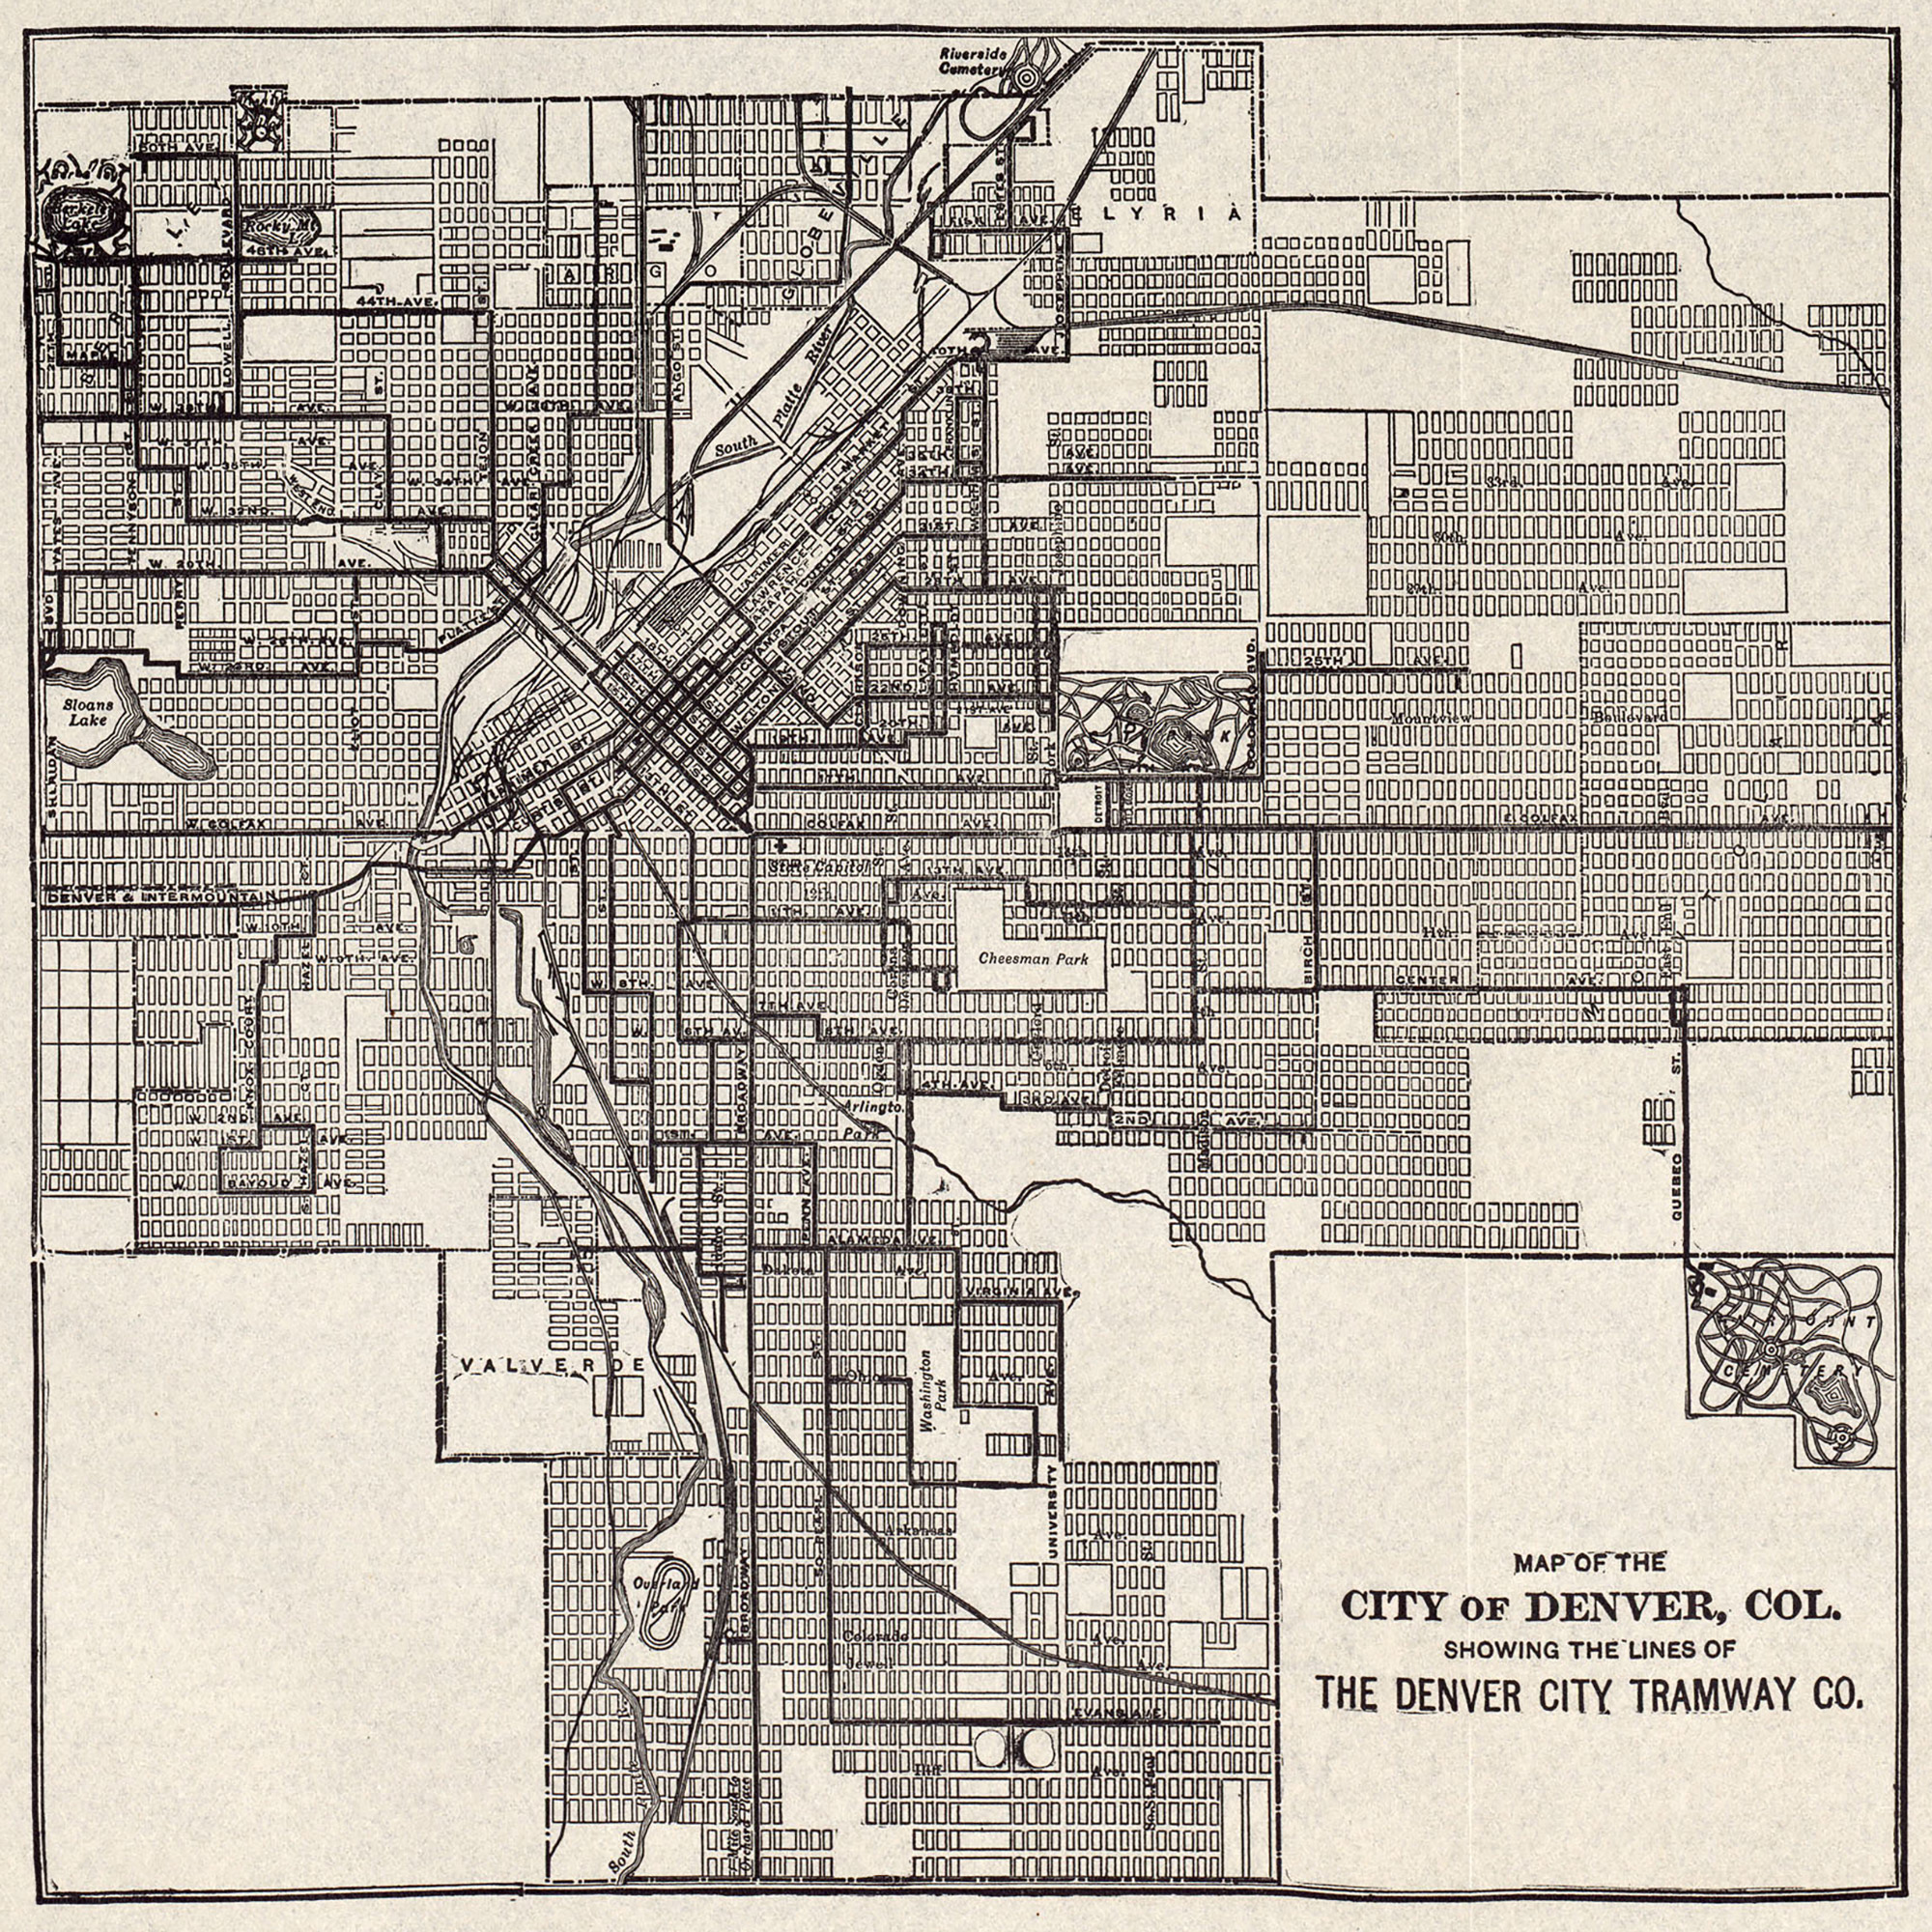
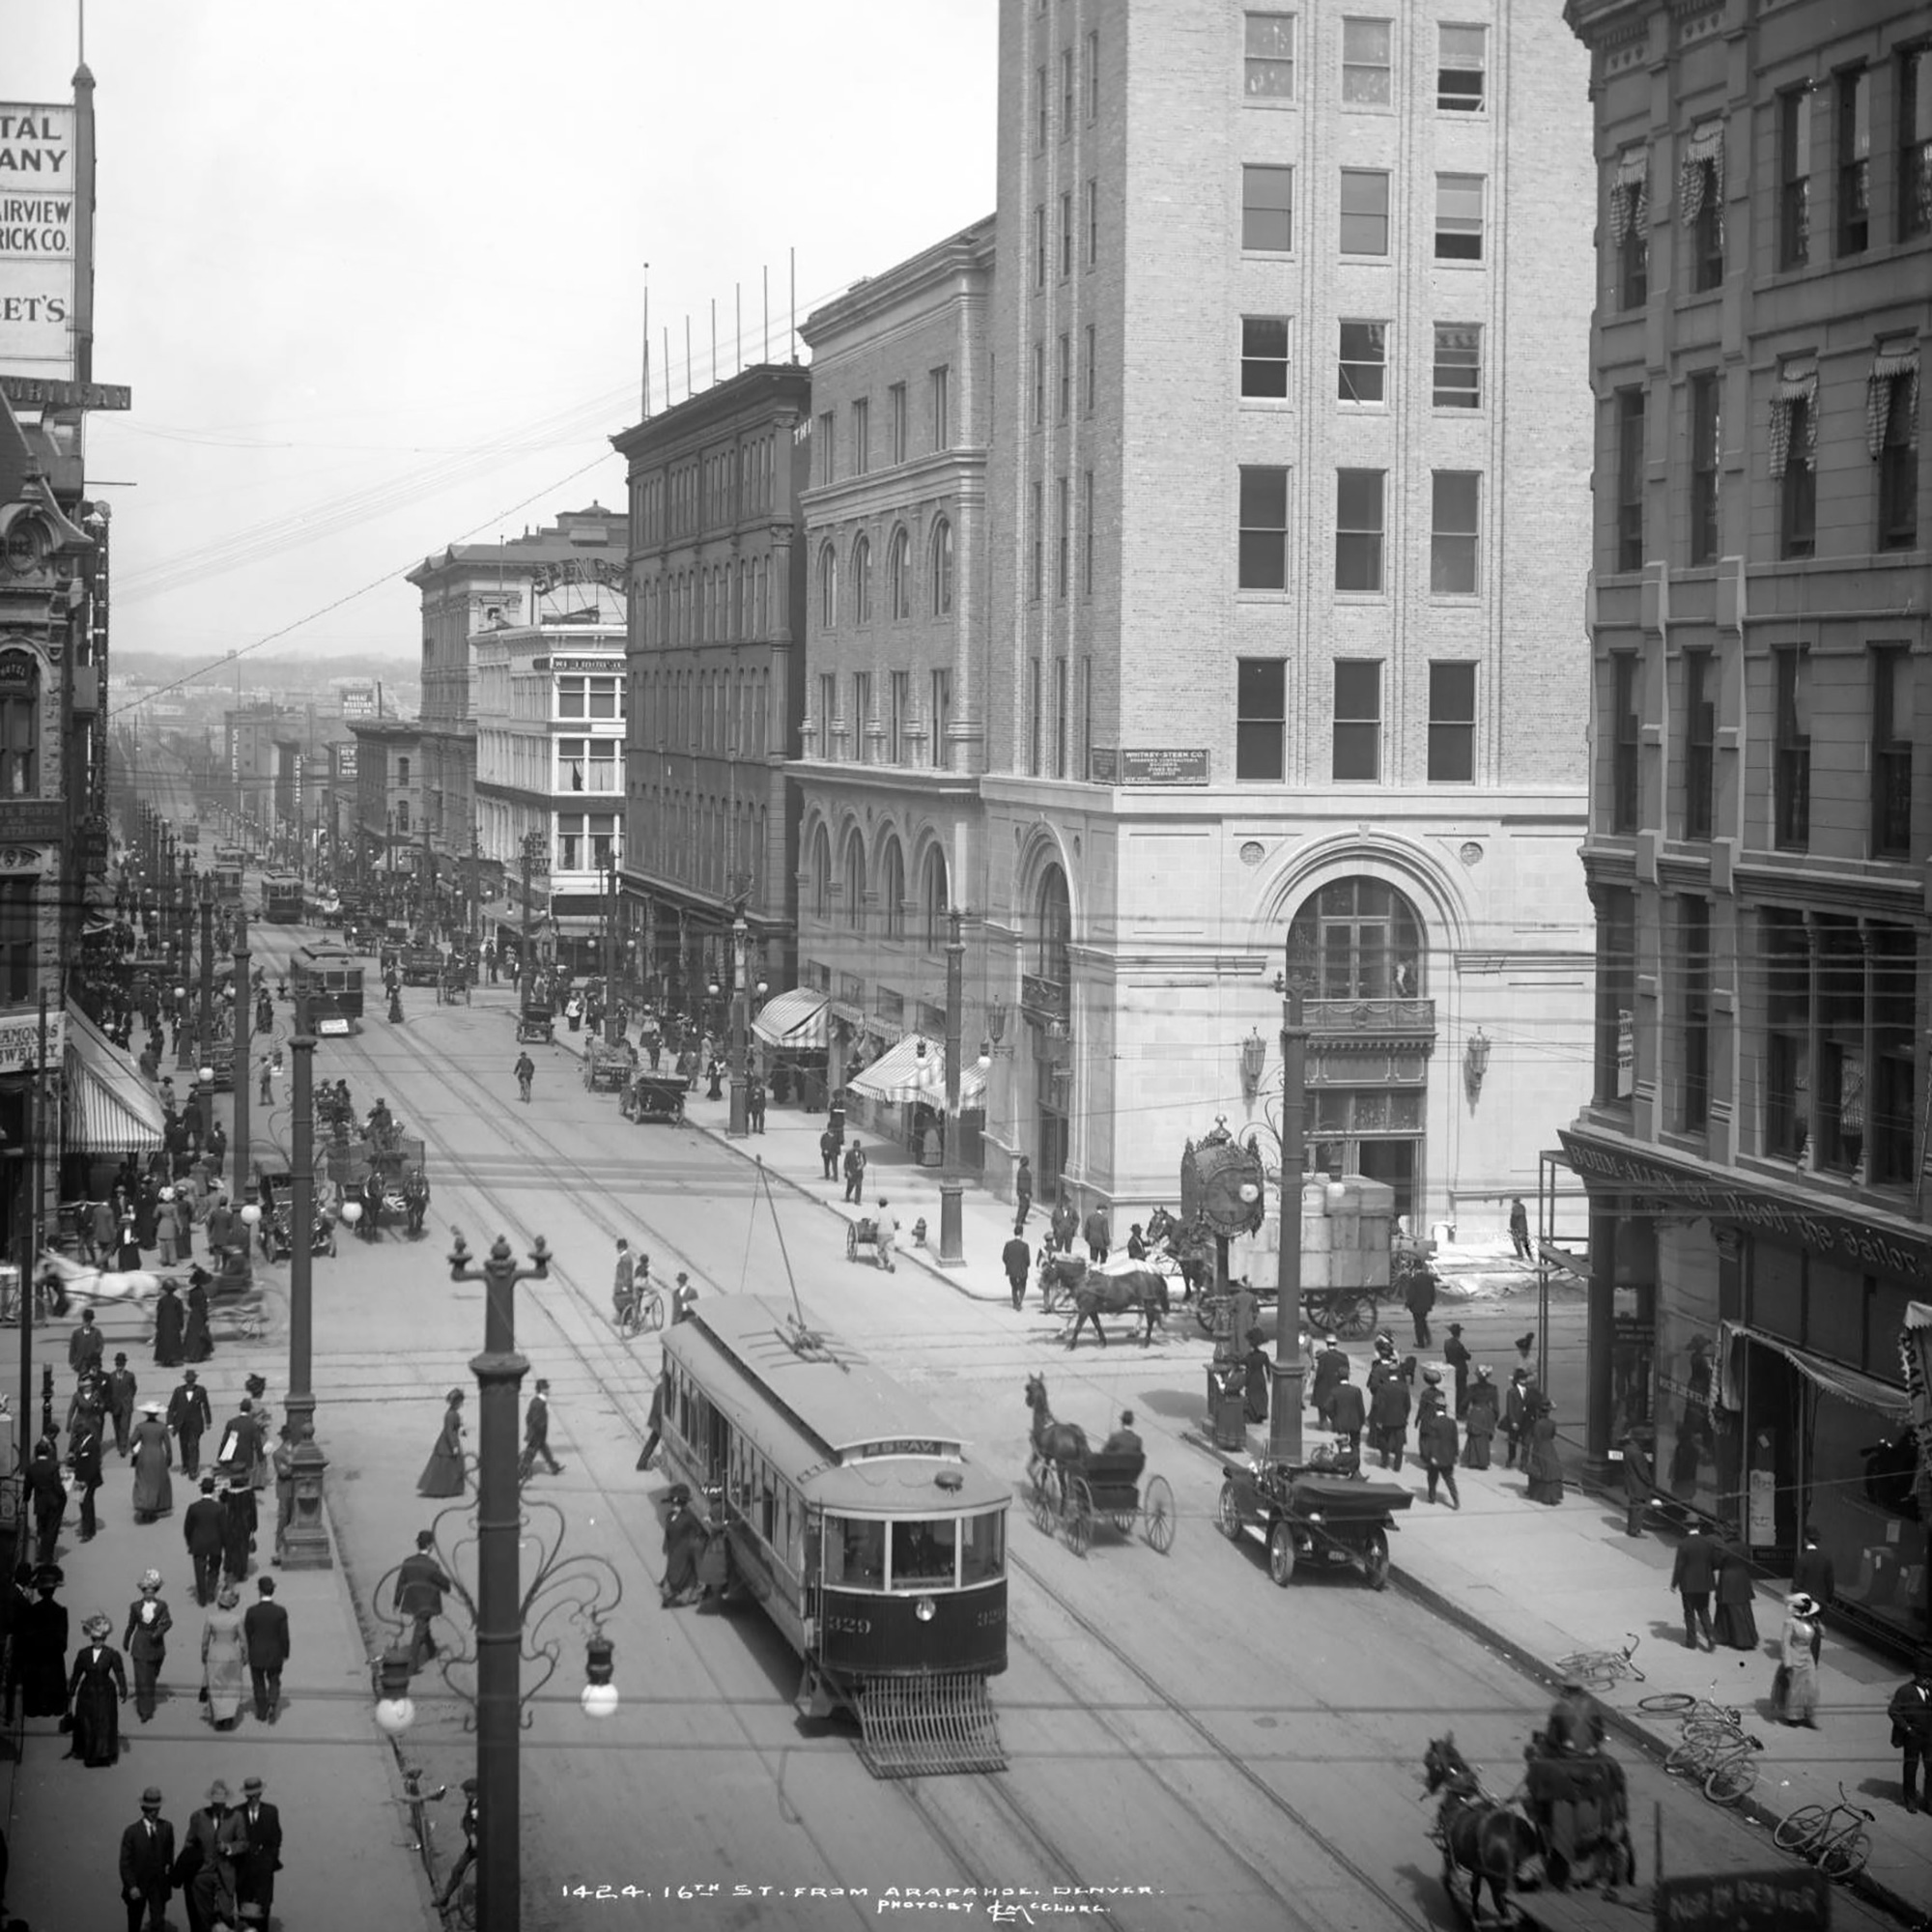
Many people, even some longtime residents of the city, would be surprised learn that Denver once had a world-class public transportation system in the form of streetcars. These street railways existed for 78 years of the city’s history and once densely covered a large portion of the modern city proper. Below is a map (source) of the system in 1913 and a photograph of 16th Street in Downtown Denver from 1911 (source).
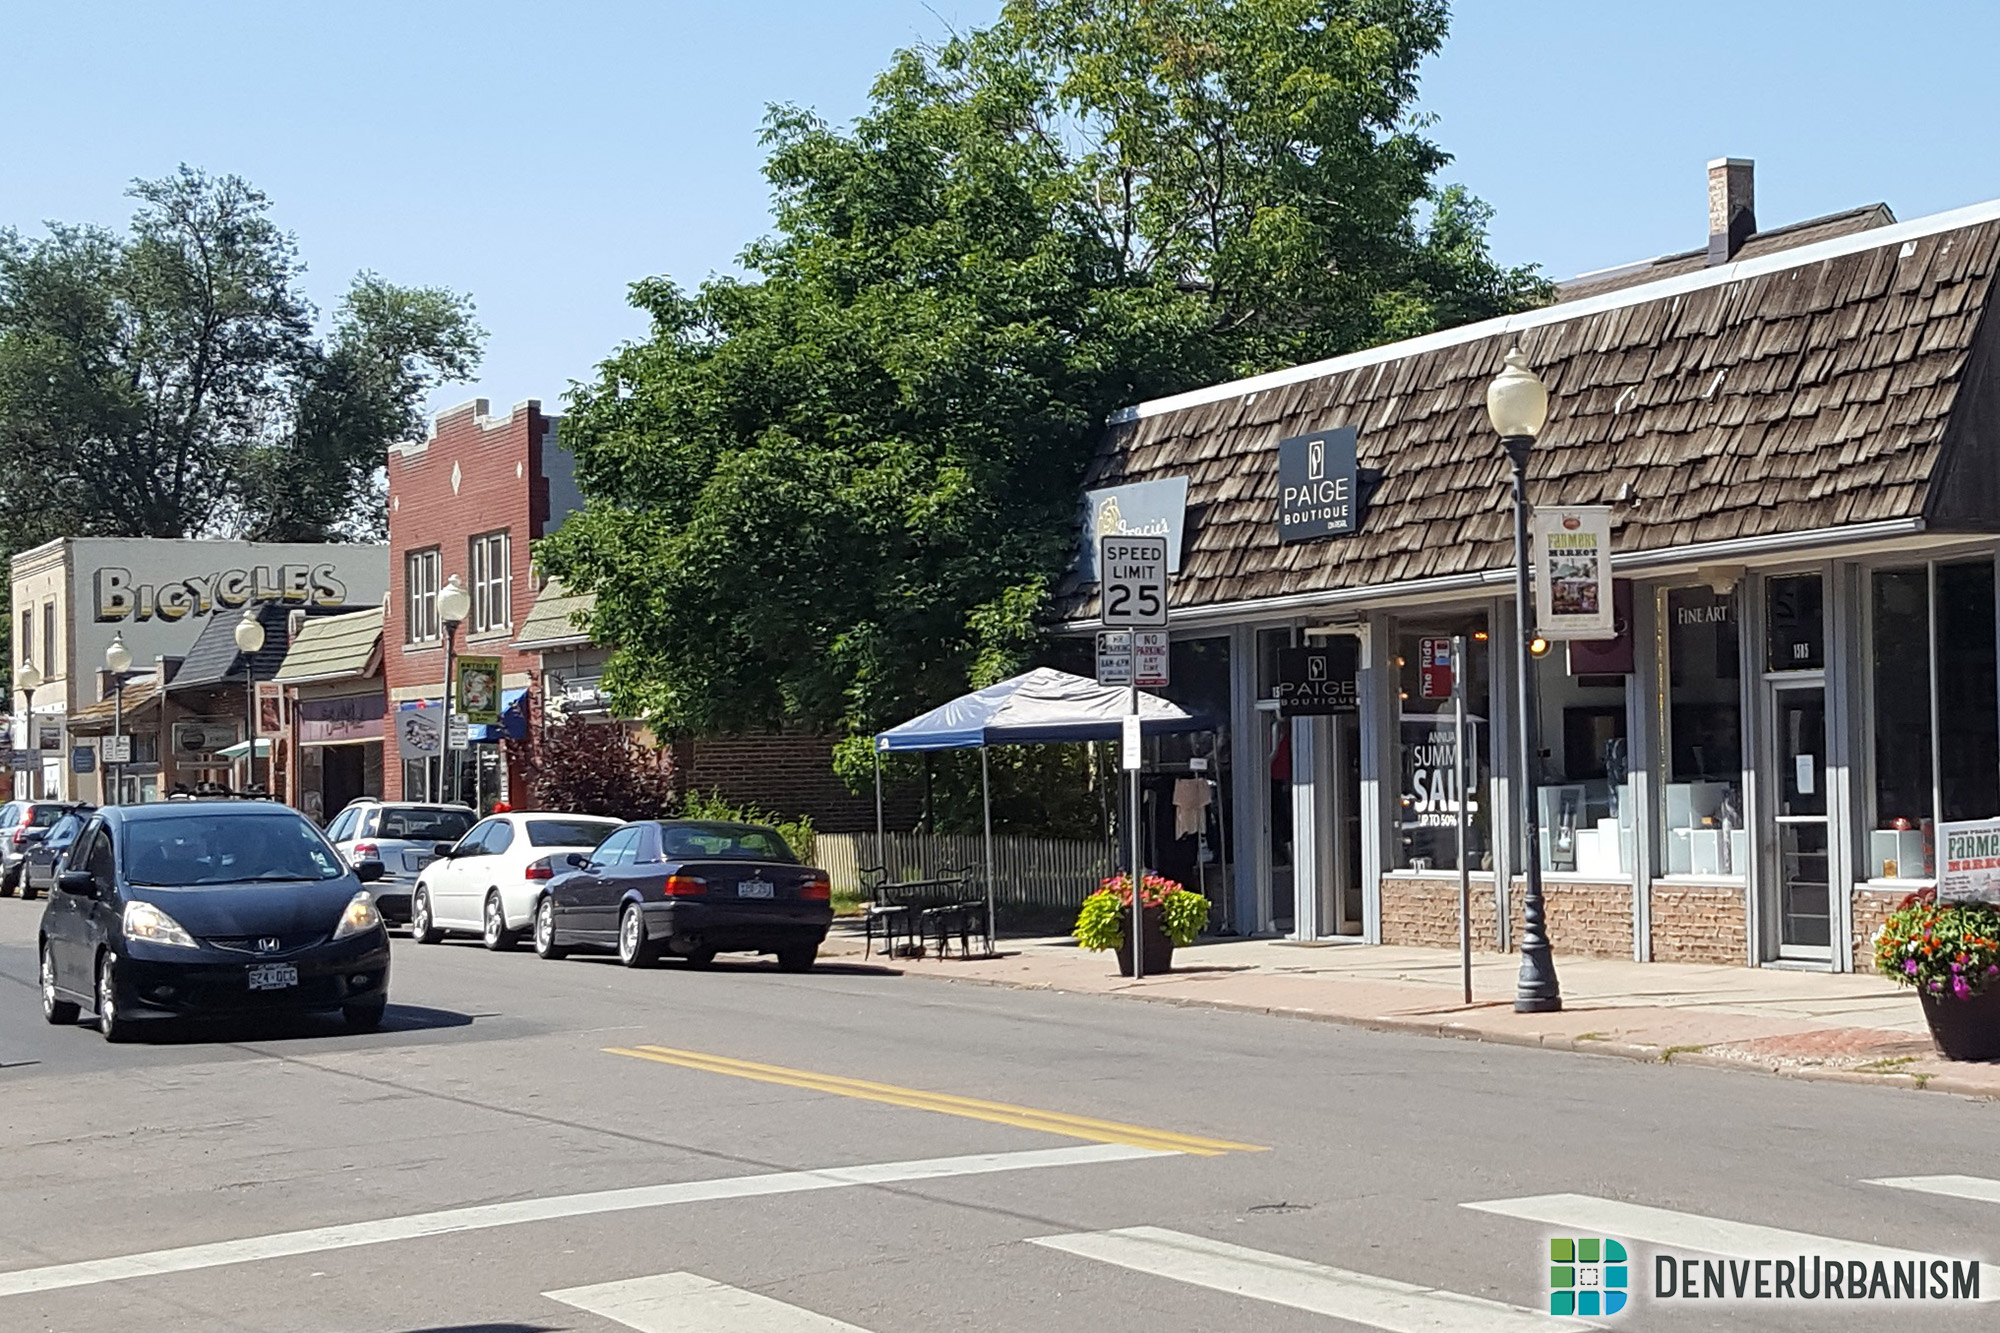
Although long gone today, evidence abounds of the streetcar’s presence in the city, mainly in the form of old commercial strips lining arterials like Colfax and Broadway, and embedded in neighborhoods on streets like South Pearl (below left) and Tennyson. This legacy in the built environment is not only valuable for its history and aesthetic. It also contributes to the walkability of Denver’s neighborhoods. Because these developments are scattered in close proximity to residences, more people are within walking distance to many types of businesses and services than they would otherwise be, as seen in the map (below right) of northwest Denver.

As a master’s student studying GIS (geographic information science) at the University of Denver, I recently completed a capstone project that focuses on this subject matter. Over the next couple of weeks, I will post several articles about the results of this project and the interactive web mapping application that I built for it. For this first post, I provide some background on how I came to focus on this topic for my master’s capstone…
I left car-dependent suburban Indianapolis where I grew up to attend graduate school here in Denver. I had a vague idea to use GIS to study something relating to urban sustainability, but I wasn’t sure what exactly. So I delved into the academic literature and soon came upon the subject matter that has become my driving passion to the present day: the negative externalities of cars and the role that the urban built environment plays in influencing our transportation mode choices.
I learned that the sprawling development patterns of most American cities (see Google image below), with their low densities, segregated land uses, and poor pedestrian design are directly responsible for the vast majority of Americans needing to drive everywhere. This has resulted in many very poor outcomes for the well-being of our urban communities. Over 35,000 people died in car accidents and over 2 million were injured in 2015, resulting in an annual economic impact of over 200 billion dollars in medical costs and property damage. Cars are also implicated in our outrageous obesity rates because they facilitate inactive lifestyles, their tailpipes spew pollution and contribute to global climate change, they cause tremendous noise pollution, and they erode community social capital by preventing social encounters in the public domain.

Urban municipalities all over the country, including Denver have recognized this and have set goals to reduce our excessive level of automobile dependency. After exploring various potential directions that I could take based on the academic literature that deals with these issues, I decided to change paths and seek a client for my project instead. I found a planner at Denver’s Community Planning and Development department named Andrew Rutz who was interested in working with students. He was curious about the pleasant, pedestrian friendly commercial corridors I mentioned earlier and having me do a GIS project around that. I really liked the idea and ran with it.
I proposed to focus on three related themes: the actual streetcar routes, the legacy of the streetcar in the built environment, and the impact of that legacy on neighborhood walkability. I planned to do a great deal of GIS digitization and analysis on these topics, and then host the results on an interactive web mapping application, viewable to the public, called an ESRI Story Map.
In the following chapters, I delve into each of these three related concepts. By clicking on the button below, you can open the Story Map application. A map dominates the right side of the screen, and a sidebar is present on the left. The sidebar has three sections that control the content of the map. Under each section header are text and pictures that explain the map under consideration.
Click the button below to open the Story Map application.
Below is a quick summary of each section:
Section 1: Streetcar Routes: This section displays every streetcar route that ever existed in the city of Denver. By using the time slider, you can see how the network was configured year-by-year, from the first horsecar line in 1872 to the last streetcar lines in 1950. Open the time slider by clicking on the blue circle button on the toolbar at the bottom of the map.
Section 2: Streetcar Legacy: This section maps every Streetcar Neighborhood Commercial Development, a concept of my own devising, in the modern city of Denver.
Section 3: Streetcar Neighborhood Walkability: This section takes a look at a northwest Denver neighborhood to see how Streetcar Neighborhood Commercial Developments impact the ability of residents to access their day to day destinations on foot.


Please explore the Story Map application, and then continue reading as I explain each section of the Story Map in detail below.
CHAPTER 2: THE HISTORY OF DENVER’S STREETCARS AND THEIR ROUTES
For this chapter, please make sure you have explored the —Section 1: Streetcar Routes—which displays all the streetcar routes that ever existed in the modern city proper and filter them using a time slider to see which routes existed during any given year.
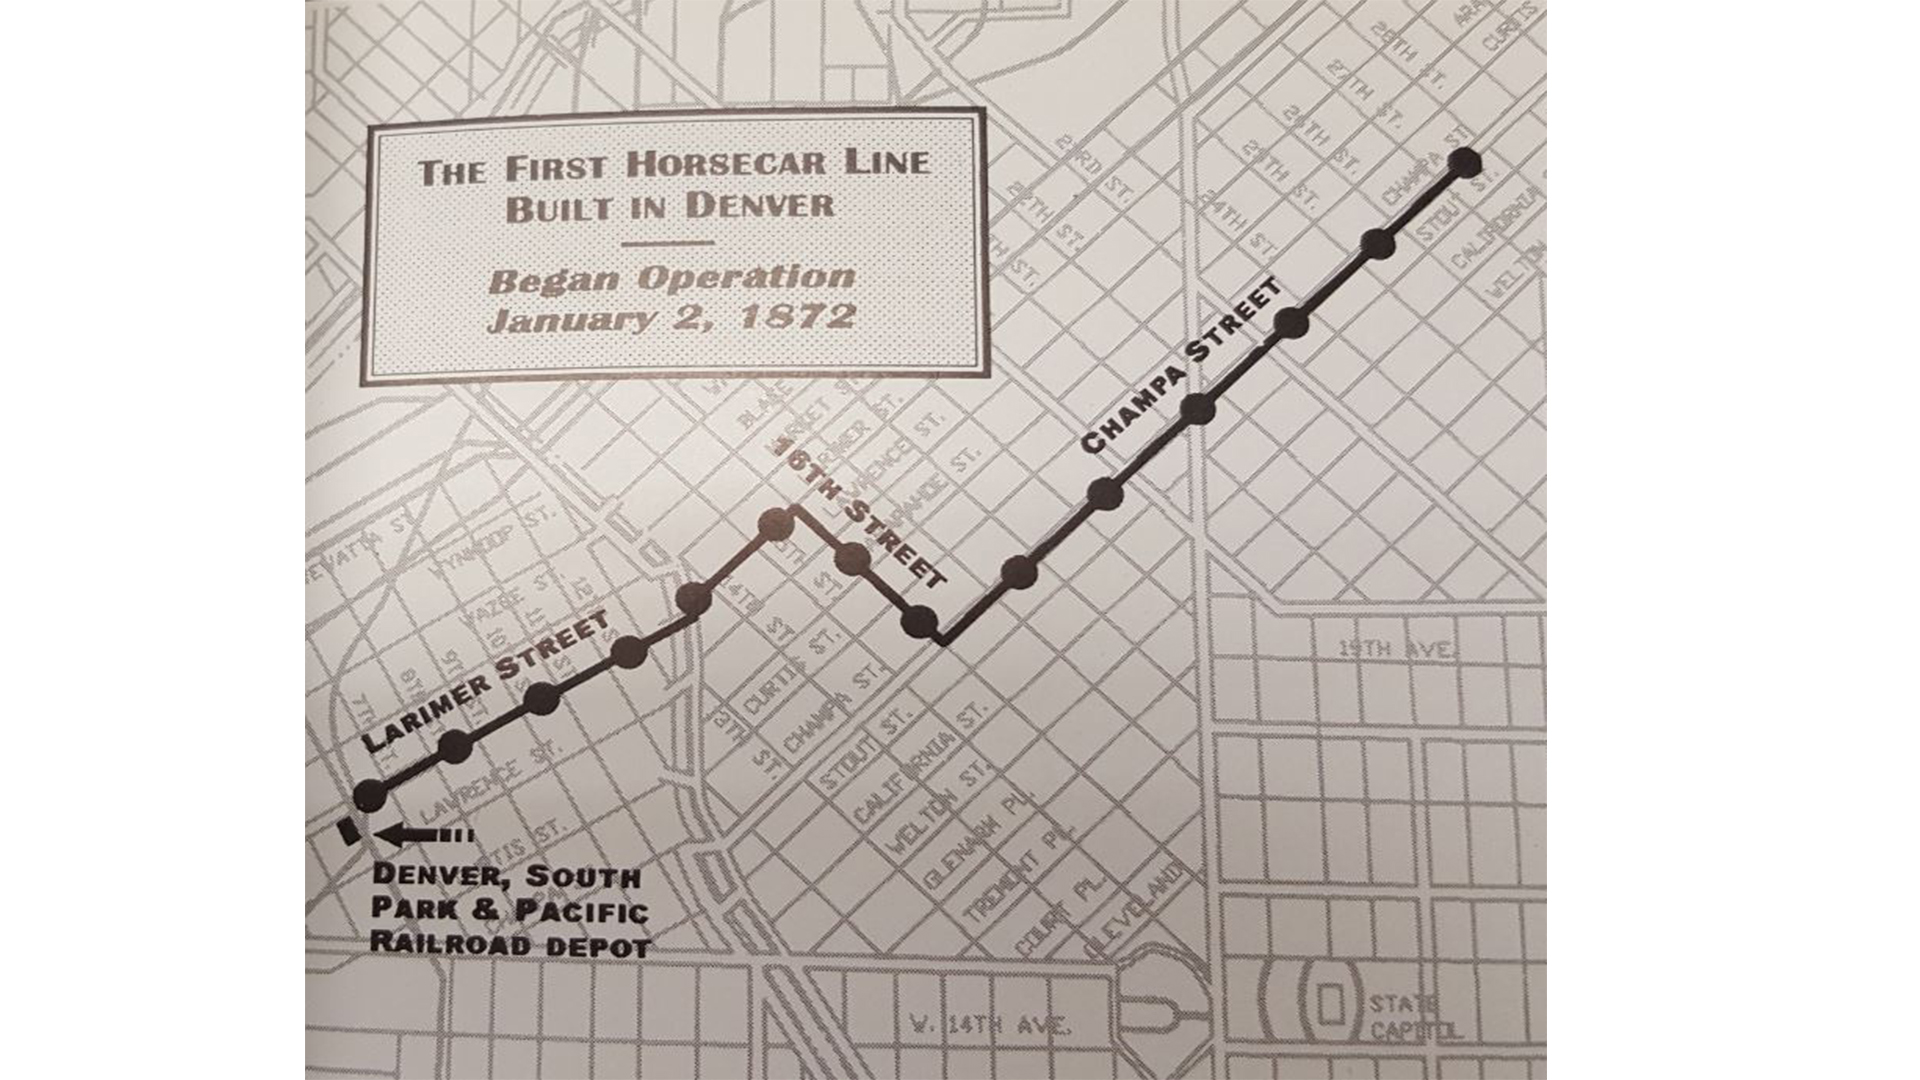
Once upon a time, there were no cars in Denver. In 1861, when the city was incorporated, people traveled around town either by foot or by horse. By 1870 the town had grown to a population of about 4,700 people and became large enough to make walking from one side to the other time consuming. Not everybody had the luxury of getting around by their own private or hired horse. In 1872 the Denver Horse Railroad Company built the first public transit line in Denver. It consisted of a horse-drawn rail carriage going from Auraria to Curtis Park.

By 1880 the trackage had expanded modestly, perhaps doubling in total length, covering an area from Broadway at Speer to Larimer at 33rd going north-south, and Federal to Ogden going east-west. The population in this time however had ballooned seven-fold to 35,000. News reports at the time lamented the inadequate state of the network. In the face of pent-up demand and continued population growth, the 1880s saw the biggest single-decade expansion of the network in its 78-year history.
By 1890, when the population tripled to 106,000, nearly every block in downtown and modern Five Points/RiNo had a streetcar line. Lines covered the full length of Broadway and Colfax, and the northwest side around Berkeley had multiple routes. These lines were built by many fiercely competitive startup companies. Competition was so intense, that on occasion one company would rip up the rails of another while building their own!


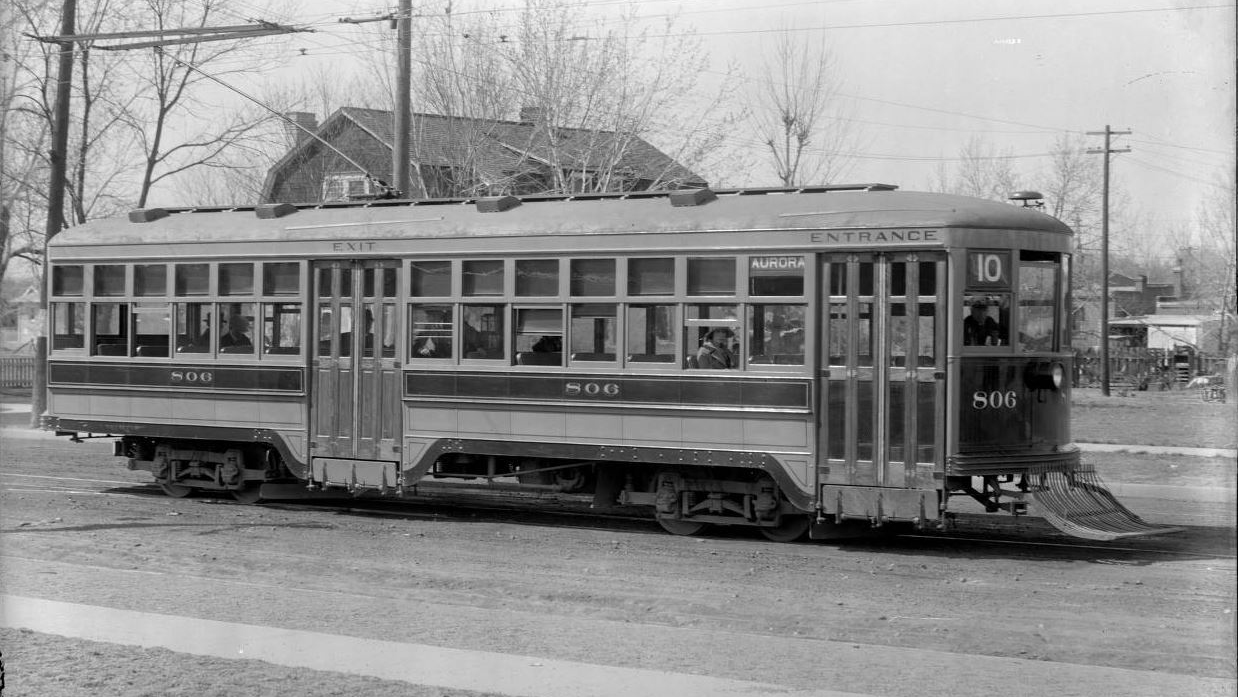
New means of conveyance also appeared. Many of the new routes were cable cars (below left). Driven by a central powerhouse, miles of sunken cables moved along next to the tracks, which the cable cars latched onto for propulsion. Additionally, steam engine streetcars were also built, including one which went out to the newly relocated University of Denver campus. In the early 1890s the electric streetcar came on the scene, powered by overhead wires (below right). By the time of the economic Panic of 1893, they had become dominant. The Denver Tramway Company owned the bulk of these superior electrified lines, and was thus better positioned than its competitors.

When I first set out on this digitization project, I wanted to record the means of conveyance of each line. I found this to be impossible because the network was simply too dynamic and too complicated with all these different companies operating. Oftentimes one street would have multiple companies operating multiple tracks, each with a different propulsion mechanism. I had assumed that the network was operated by one company and grew in an orderly fashion over the streetcar’s whole history. How wrong I was!
The recession in 1893 largely brought a halt to street railway expansion, and ushered in an era of consolidation. Companies merged, and redundant lines were taken out of service. By the new century the Denver Tramway Company emerged with a monopoly on streetcar service operation in Denver. Expansion picked up again in the early 20th century, but at a much slower pace. By this time automobiles had become affordable to a large swath of the population and the Tramway became aware of the threat it posed.
In 1915 they commissioned an interesting survey of the mode share of people traveling in and out of the central business district. 51% rode streetcars, 38% walked, 13% drove automobiles, 6% rode bicycles, 1% drove motorcycles, and 1% used horses. They also found that compared to 1914, streetcar patronage had dropped by 9% and driving had doubled. However in subsequent years the raw numbers of streetcar patronage again increased.
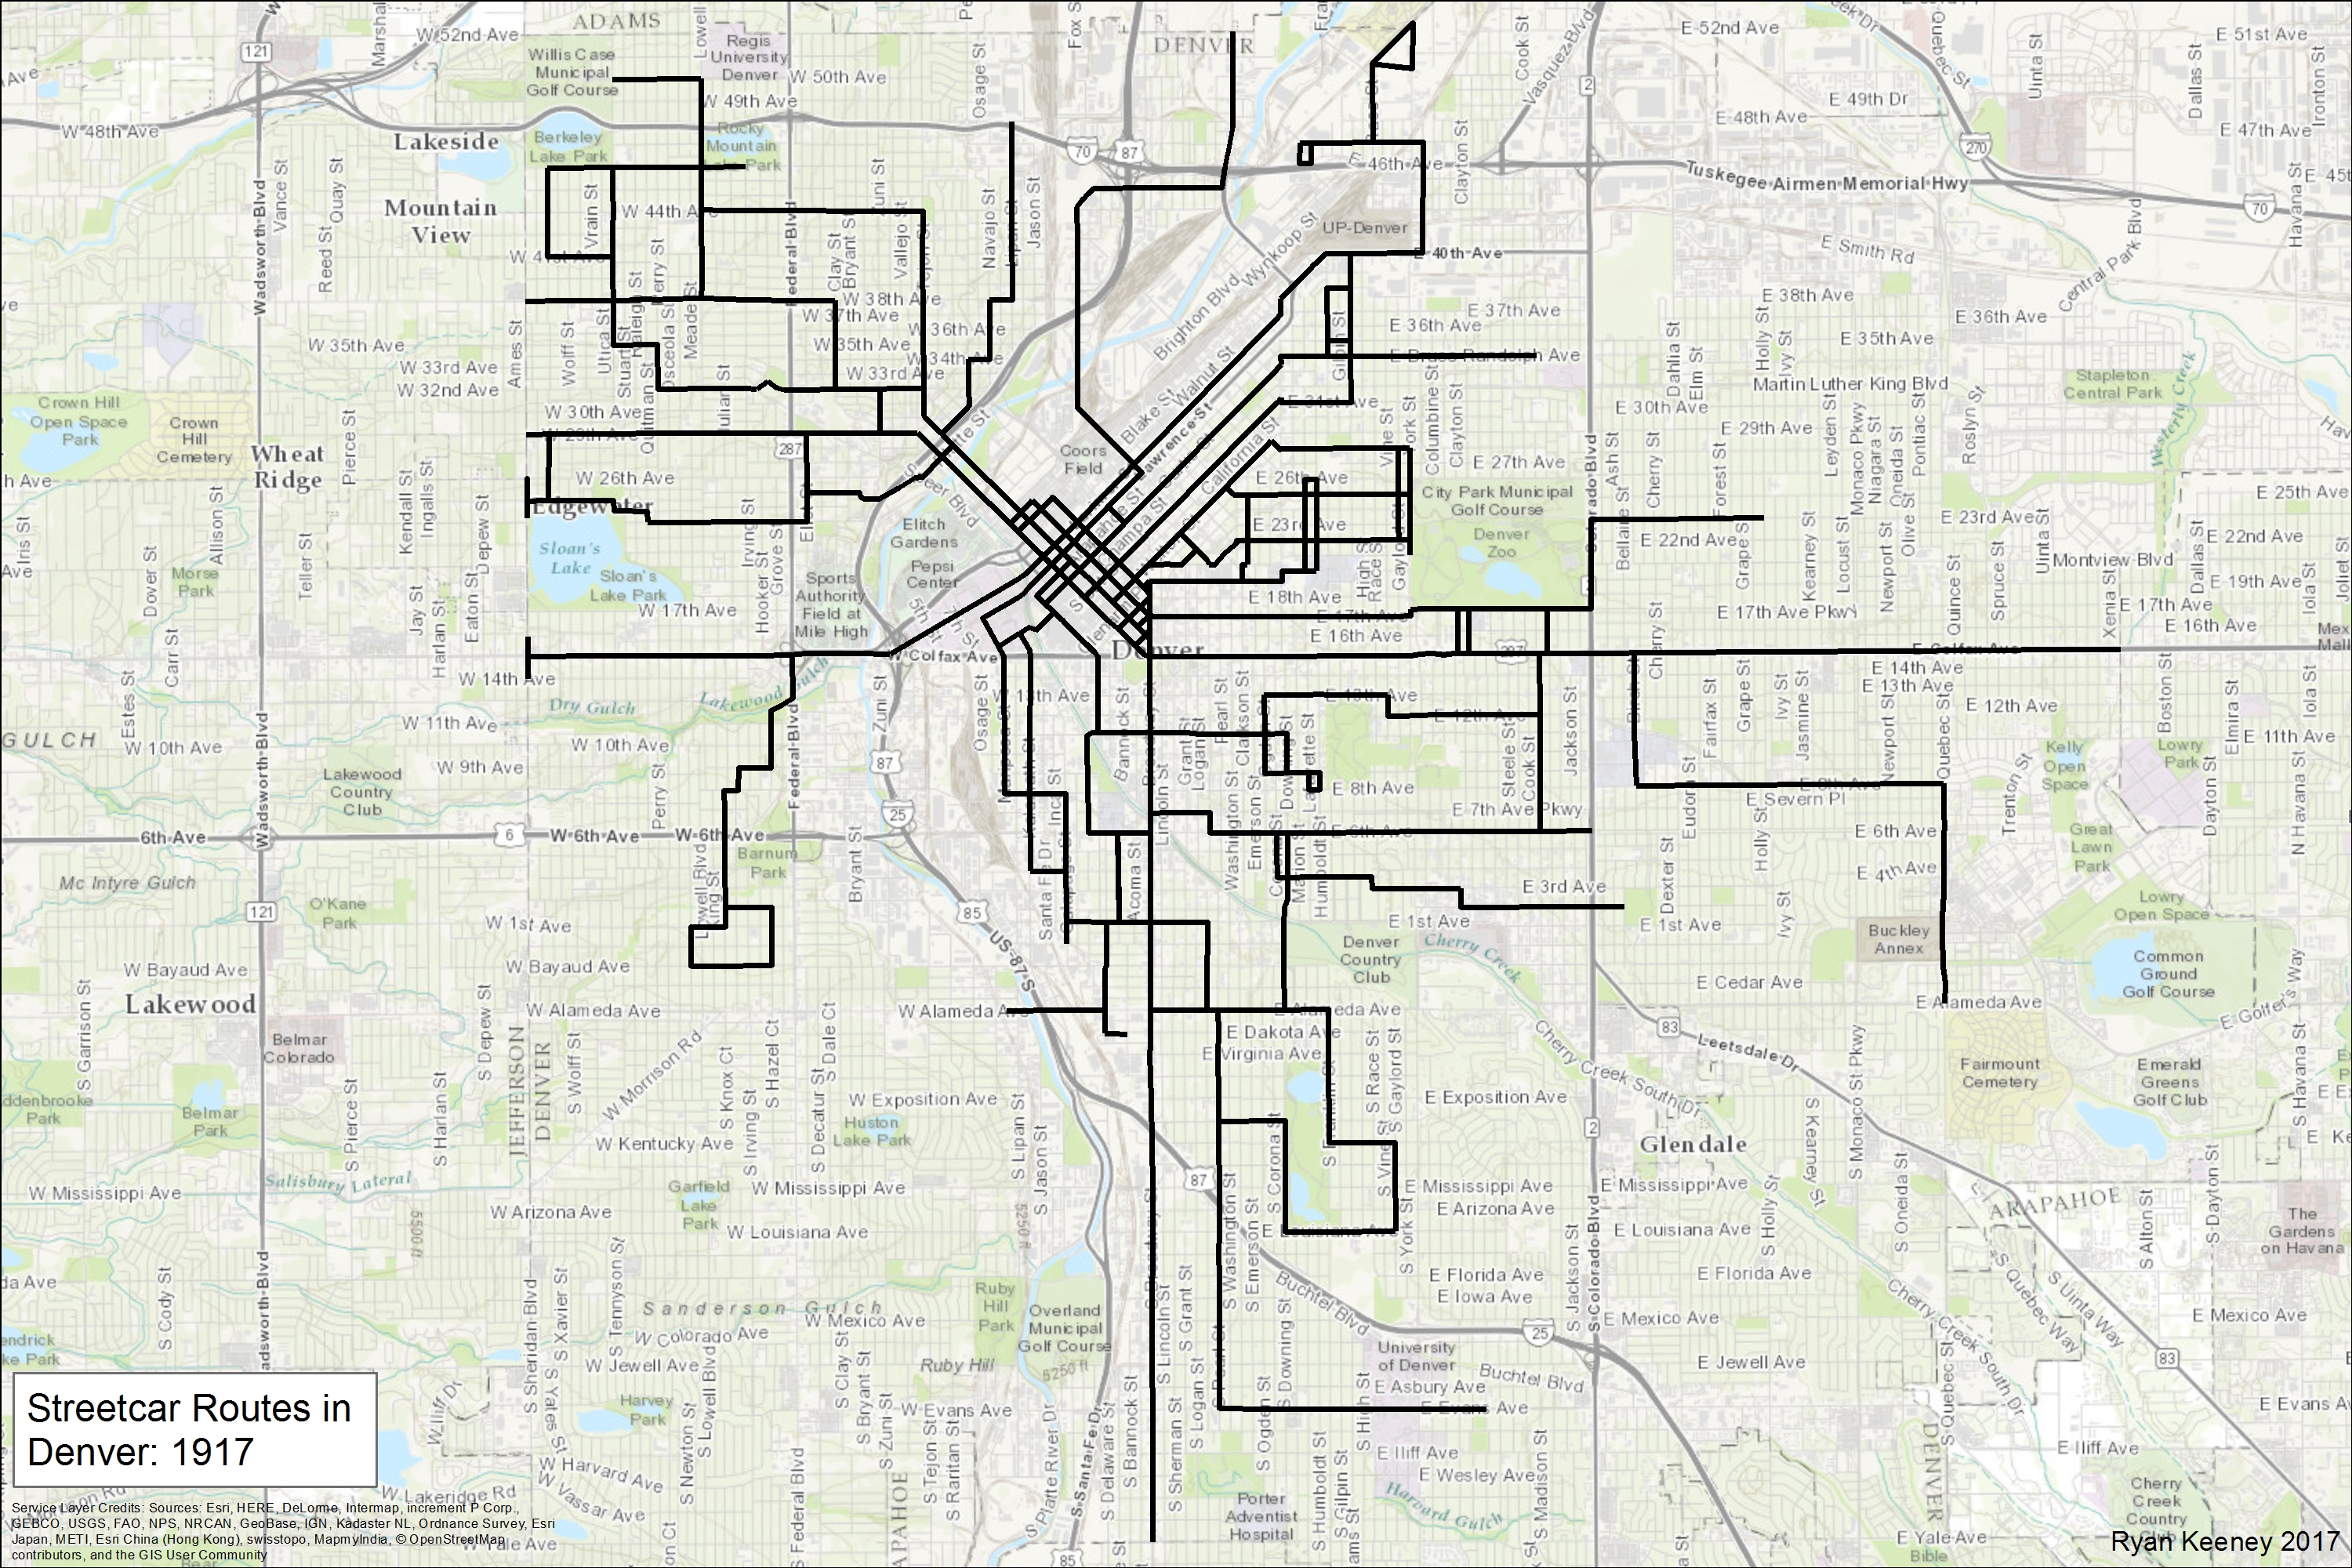
It was around 1917 that the streetcar system reached its peak in terms of coverage (below) with the construction of a line to Barnum. After this was a long decline, with many lines being taken out, and the last new segment being built in 1923. Looking at ridership itself, it peaked in 1910, with 87,819,000 passengers. At the time, 3,000 automobiles were present in the city. By 1928, the number of private automobiles had increased to 78,000 and streetcar ridership declined by 59%.
The late 1920s and early ’30s marked the beginning of the conversion of many rail routes to bus routes but, as in the Panic of 1893, the Great Depression put a stop to this, stabilizing the rail system until 1940. At this time, trolley coaches, which are essentially buses powered by overhead electric wire, along with gasoline buses, began replacing some of the less heavily used streetcar routes. This conversion process didn’t last long though, ending with the removal of rail tracks on 16th Street in July of 1941, because soon the United States became party to World War Two after the Japanese attack on Pearl Harbor. Gasoline and rubber were rationed due to the war effort, causing ridership to increase for the last time, and the system again remained stable until the end of the war in 1945.


After the war the economy boomed and a huge push for modernization in all aspects of life occurred. Many Denverites regarded the streetcars as ancient, noisy, and obsolete. With the advent of larger diesel buses, the removal of the streetcar lines accelerated, and the plurality in terms of transportation mode share that the streetcar had enjoyed since the late 1800s came to an end. By 1951, all streetcar lines were gone and the Denver Tramway became an all bus and trolley coach operation. The electric trolley coaches themselves were taken out of service in 1955.
In the first half of Denver’s history, public transportation in the form of streetcars was the dominant mode of travel that people used to get around. Because of this, most of the city proper was built around these lines. In the next chapter, we will take a look at how the built environment developed in symbiosis with the streetcars, and how that legacy remains with us today.

The images of the first horsecar route, the trolley bus, and the color streetcar are from Denver’s Street Railways Volumes I and II. If you are interested in the history of Denver’s streetcars, I highly recommend taking a look at these books, as they are filled with fantastic images and a brilliant historical narrative. They served as my primary data source for the route mapping, along with most of the information in this chapter. The remaining non-map images are courtesy of the Denver Public Library Digital Collections.
CHAPTER 3: THE LEGACY THAT DENVER’S STREETCARS LEFT BEHIND IN THE MODERN CITY
For this chapter, please make sure you have explored the —Section 2: Streetcar Legacy—which defines and maps “Streetcar Neighborhood Commercial Development” sites throughout the city.
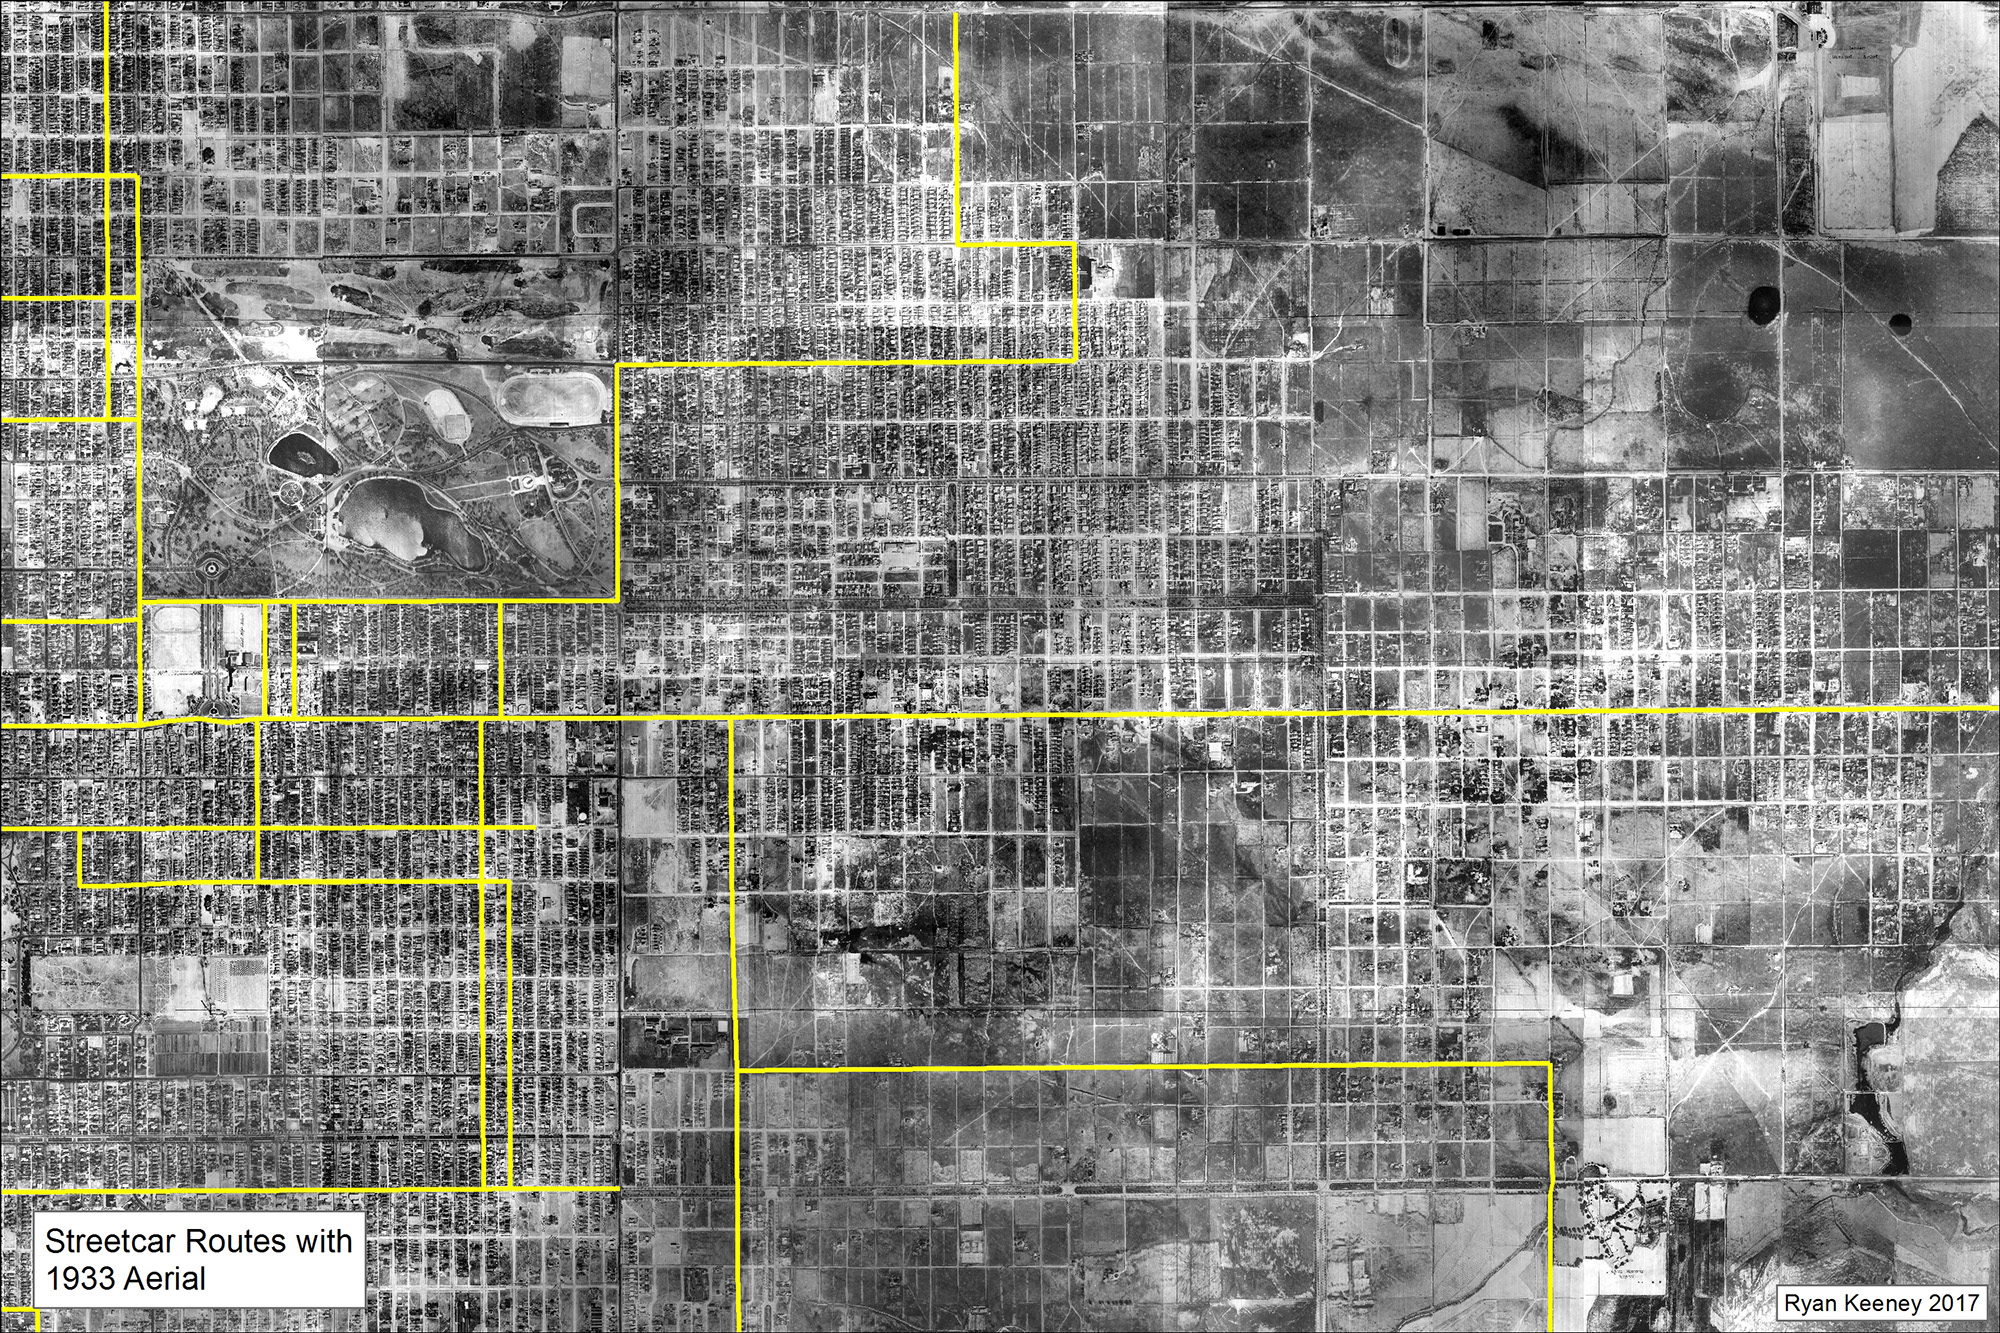
Just as cars and highways shaped the urban form of modern American metropolitan areas by encouraging dispersed patterns of development, a similar process occurred with the streetcar in the first half of Denver’s history. Denver once existed as a very compact city with development reaching only as far as the edges of the modern central business district. When the streetcar entered the picture, the footprint of the city began to expand along the streetcar routes. As late as 1933 (first three images below on left) the development of the city was tightly bound to the streetcar lines. The city existed as a grid of streets with rows of buildings clustered tightly about the streetcar lines, with open land only a few blocks beyond.
The difference between rail transit and highways lies in the degree of dispersion. With the streetcar, people had to walk to and from the stops. This naturally limited this distance that buildings could be built from the stops to no more than about a half mile, often less. With highways (below far right) this is not the case. When a motorist exits a highway, they continue to drive until they reach their final destination, where they can then almost always park on site. Walking is hardly a factor anymore, so development can spread farther from the highway without any travel time sacrifice.


So walking is part of any transit trip. You have to walk from your origin to the closest transit stop, and from the transit stop where you get off to your destination. This was daily life for most Denverites in the first half of the city’s history and the built environment was configured to facilitate this with a tightly gridded street pattern clustered about the streetcar lines. Additionally, commercial centers also developed on the same streets as the streetcar right-of-way. This allowed the people walking to and from the streetcars to purchase goods and services before continuing on their way.
These commercial nodes capitalized on the foot traffic generated by the streetcar to succeed. As a result, every neighborhood in the city had a vibrant commercial center and nearly every household in the city was within walking distance of most of their daily needs.
Today, the streetcars are gone, but many of these commercial centers remain. The most obvious examples are the continuous corridors on arterial streets like Broadway and Colfax, but they are also scattered on more neighborhood-oriented streets like South Pearl near Florida, Gaylord at Mississippi, and Tennyson at 41st. It is these neighborhood commercial nodes that are particularly special because they lack the noisy and dangerous automobile traffic of bigger streets, and are therefore more pleasant for the pedestrian. For my master’s capstone project, I mapped every single one of them.

There are no official terms that describes these developments that I could find in any academic or urban planning literature. Therefore I have come up with my own: Streetcar Neighborhood Commercial Development, or SNCDs for short. I define them as clusters or corridors of pedestrian-oriented commercial buildings (POCBs) located adjacent to an abandoned streetcar line on a road with fewer than four vehicle lanes. So let’s break down the term. The “streetcar” refers to how the buildings once depended on the people who rode the streetcar. The “neighborhood” means that they are neighborhood serving. Therefore, big arterial roads with four or more lanes are excluded. Finally, the “commercial development” refers to how the buildings must contain some sort of business, whether it is a store or an office.
So what is a pedestrian-oriented commercial building (POCB)? They are the kinds of commercial buildings which are clearly built with pedestrian access in mind. Again I came up with my own criteria based on the patterns I saw in the buildings and defined them as two grades:
Grade One POCB: A commercial building built up to the sidewalk with no off-street parking setback. Side parking and lawns must consume less than 40% of the lot. Rear parking must not be larger than double the building footprint (below left).
Grade Two POCB: A commercial building with a sidewalk to building entrance parking setback less than the length of the building starting from the main entrance (below middle).
All other buildings are AOCBs, or automobile-oriented commercial buildings (below right).


While mapping them, I soon found that SNCDs come in many shapes and sizes. Because of this, I also decided to classify them based on their size, their provision of POCBs, and their health. I came up with six categories, listed below, followed by an aerial photo of an example location for each.
Exceptional Main Street: These SNCDs have a historic main street feel and consist of an approximately 600+ foot street segment with Grade One POCBs covering at least 75% of the street frontage on both sides. [Gaylord & Mississippi]
Quality Cluster: More of a cluster than a corridor, these have > 75% of their street frontage lined with Grade One POCBs, but are not large enough to qualify for “main street” designation. [23rd & Dexter]
Mixed Main Street: These are large corridors, but have more automobile oriented buildings, Grade Two POCBs, and/or parking lots mixed in, causing the percentage of Grade One POCBs to fall below 75%. [1st & Knox]
Mixed Cluster: Same logic. Like a Mixed Main Street, but not large enough. [11th & Ogden]
Corner Store: Any isolated POCB which contains multiple businesses. I did not account for those which only contain one business because they are harder to locate. [Race & Kentucky]
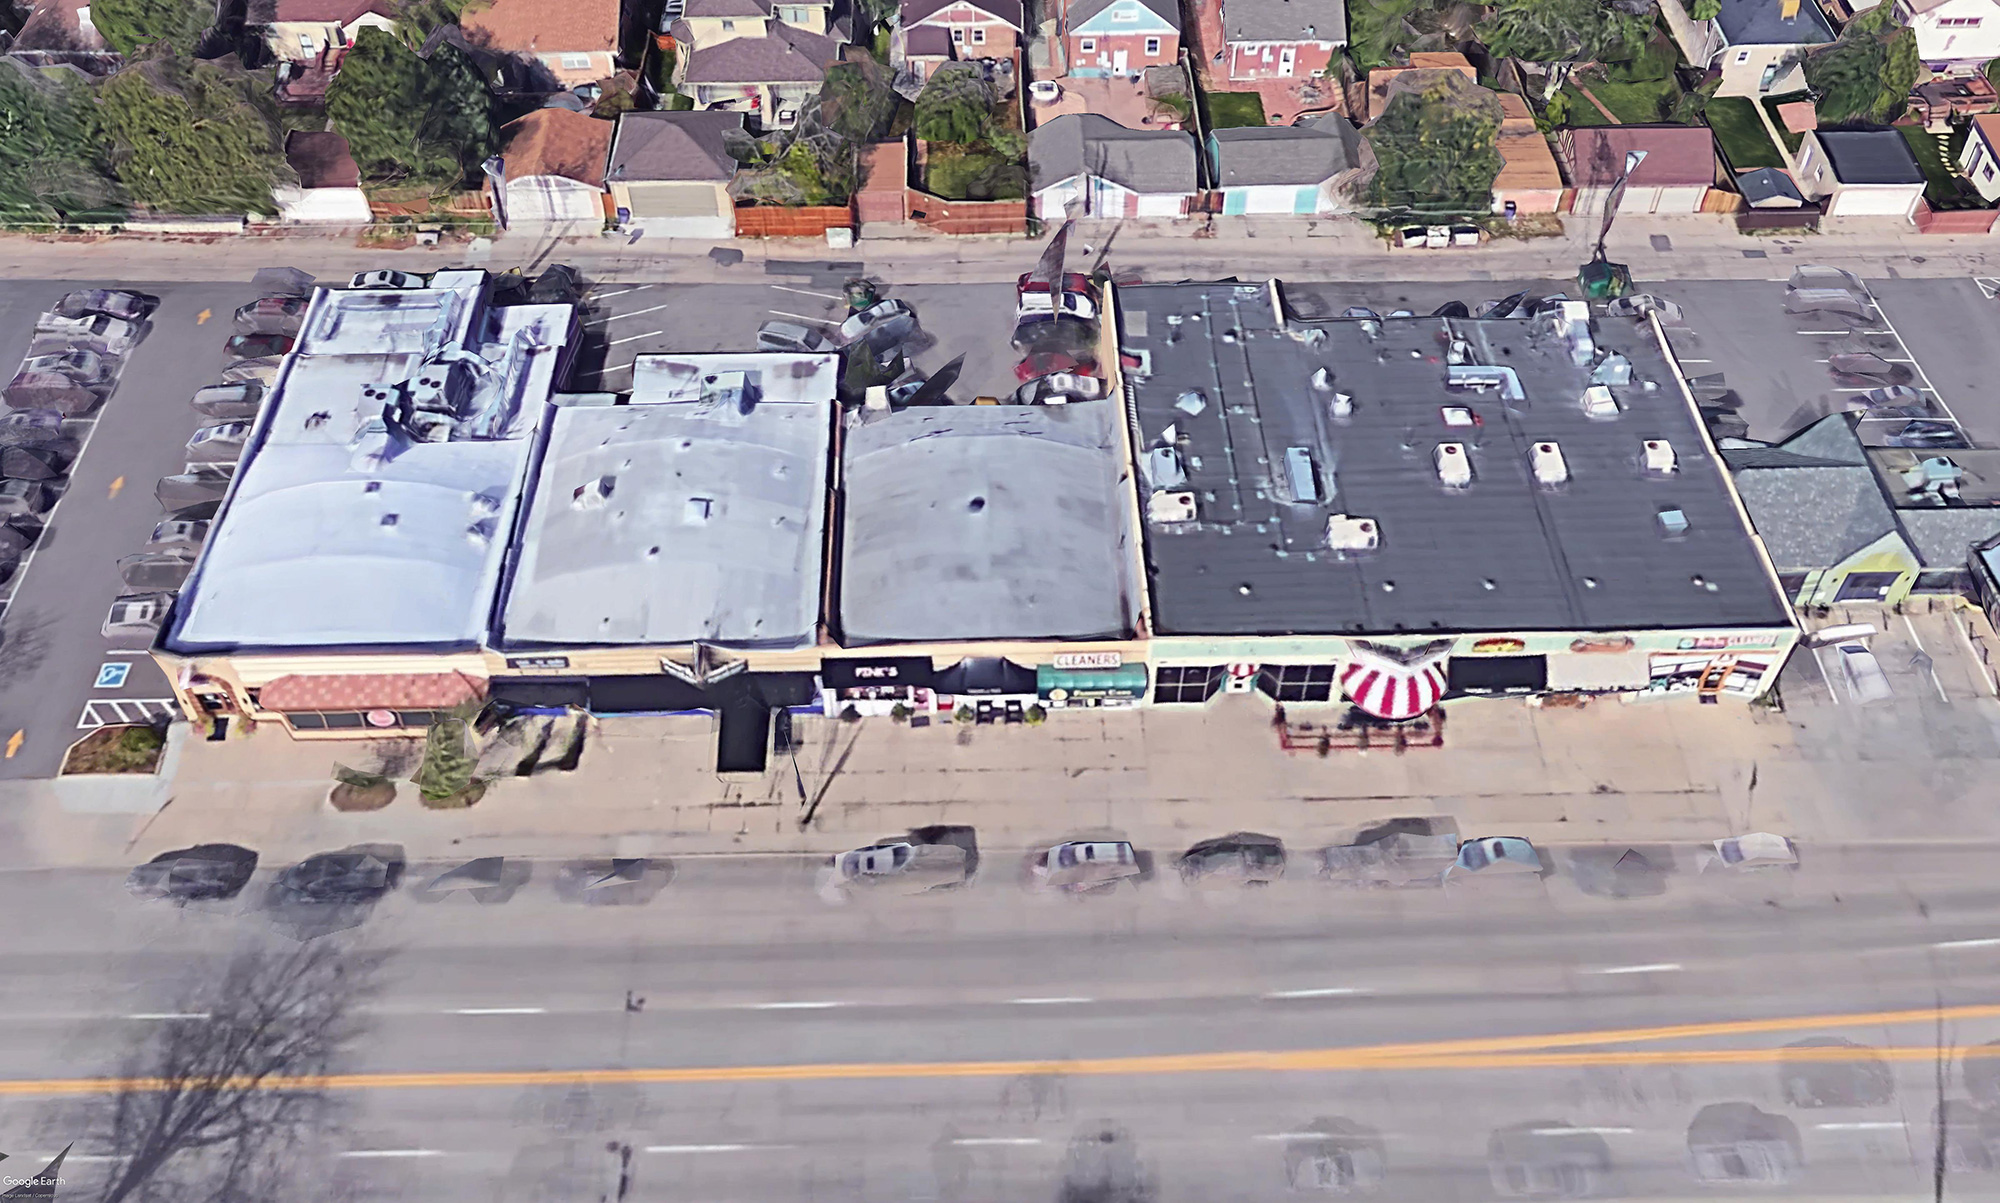
Degraded: SNCDs where most of the buildings are vacant, have been torn down, or have been converted to residential uses. This is not comprehensive, and there are certainly many more. In the final image below, you can see modern day Old West Colfax. It was once entirely lined with buildings, but now only a few remain, replaced by parking lots. [Old West Colfax]


The locations of all the SNCDs are mapped out in the application, and I have included additional goodies like information about the parcels contained within each one and links to Google Street View imagery. You can also access that 1933 aerial of the entire city.
Having mapped the location of every SNCD in Denver, I wanted to know how they affect the walkability of the neighborhoods in which they are situated. In the final chapter, I will present an analysis of this in one of Denver’s neighborhoods.
CHAPTER 4: HOW HISTORIC STREETCARS MADE THE DENVER OF TODAY MORE WALKABLE
For this chapter, please make sure you have explored the —Section 3: Streetcar Neighborhood Walkability—which analyzes the walkability of two Northwest Denver neighborhoods with former streetcar routes.
How do Streetcar Neighborhood Commercial Developments (SNCDs) affect the walkability of Denver’s neighborhoods? There are many ways to measure walkability but given my focus on SNCDs I wanted to focus on proximity to destinations that could conceivably be located in an SNCD. I came up with seven destination categories: retail, grocery stores, restaurants, services, convenience stores, entertainment, and schools/daycares. I used NAICS codes to download their locations from Esri Business Analyst.
So how did I measure proximity to these neighborhood destinations? I used a GIS technique called network analysis to answer the following question: how many destinations are located within a one-half mile sidewalk distance from each parcel in the city? I ran this analysis one destination category at a time and appended the results to each property parcel. Additionally, for each parcel, I added up the number of categories where at least one destination was accessible and called the metric “sum of categories”. All of this data curation and analysis was complex and time consuming, so I limited my area of study to a neighborhood in the northwest part of the city of Denver. I would eventually, however, like to expand it citywide.
The study area is divided into two tracts, a northern one and a southern one. The northern tract is much better provisioned with SNCDs than the one to the south. In its heart, it has an Exceptional Main Street and a Quality Cluster on W. 32nd Avenue and there are also more SNCDs just beyond its boundaries. The southern tract has only a Corner Store, and fewer SNCDs close by. There are also many business nearby both tracts on arterial roads, but neither tract has a major advantage in terms of access to them.
Below are the results. First is a series of maps, showing the number of destinations that each parcel can access. Second is a bar graph showing the average number of destinations accessible per parcel in the northern and southern tracts. It is clear that the parcels in the northern tract benefit from the increased presence of SNCDs. Every category except grocery and schools/daycares are better accessed on foot in the northern tract.


Top row from left to right: retail, grocery stores, restaurants, services. Bottom row from left to right: entertainment venues, convenience stores, schools/daycares, sum of categories.

It is likely that this picture looked significantly different during the heyday of the streetcar. Restaurants, retail, and services currently dominate the composition of the SNCDs, and you will notice that there are very few grocery stores. Small, “mom and pop” groceries were once much more prevalent but today, these have generally consolidated into auto-centric big box stores. Even so, as can be seen in my results, there is still plenty of value generated by the SNCDs. They bring many destinations and workplaces into close walking distance of residences and serve as valued neighborhood centers by the residents around them.
So that’s a wrap on the walkability analysis and this series of posts on my master’s capstone. Essentially the big theme of this project is that we can learn from our past and leverage its legacy to plan for a better, more multi-modal way of life. Denver was once a city without cars and people were able to get around just fine. They walked, they rode streetcars, and they went about their errands by patronizing local neighborhood shopping districts. Since that time the Denver metropolitan area, like the rest of the country, has grown to be more car oriented. The suburbs, where most people live today, were built around the car. You essentially need to own and operate this expensive, dangerous, multi-ton piece of machinery to go almost anywhere in these areas.
Denver proper fares better because of the legacy the streetcar left behind. Most of the city was developed before the automobile and despite the later intrusion of highways and the reconfiguration of streets to accommodate more cars, the inner city is built on a tight grid and its neighborhoods are more densely populated and mixed use. Not every neighborhood is a walking and transit paradise, but most of them have the bones to become one.
In this application, I have curated a lot of information about the history of Denver’s streetcars, their legacy in the form of pedestrian-friendly commercial districts, and the impact those districts have on the walkability of one of its neighborhoods. It is my hope that it presents Denver in a new light to many people and helps us get closer to the goal of creating a city where the car is no longer a necessity of life for the majority of its residents.