At my day job, I work in the Golden Triangle, which is a fast-changing place to live, work, and recreate. Recently, a group of colleagues and I had reason to talk about the direction in which the neighborhood is changing, and how we wanted to proactively engage the many, many new residents of the neighborhood. To prepare for this workplace conversation, I spent some time on the Census Bureau’s website, viewing data by census tract (CT). First, a couple high-level numbers I thought would be of interest to my workplace.
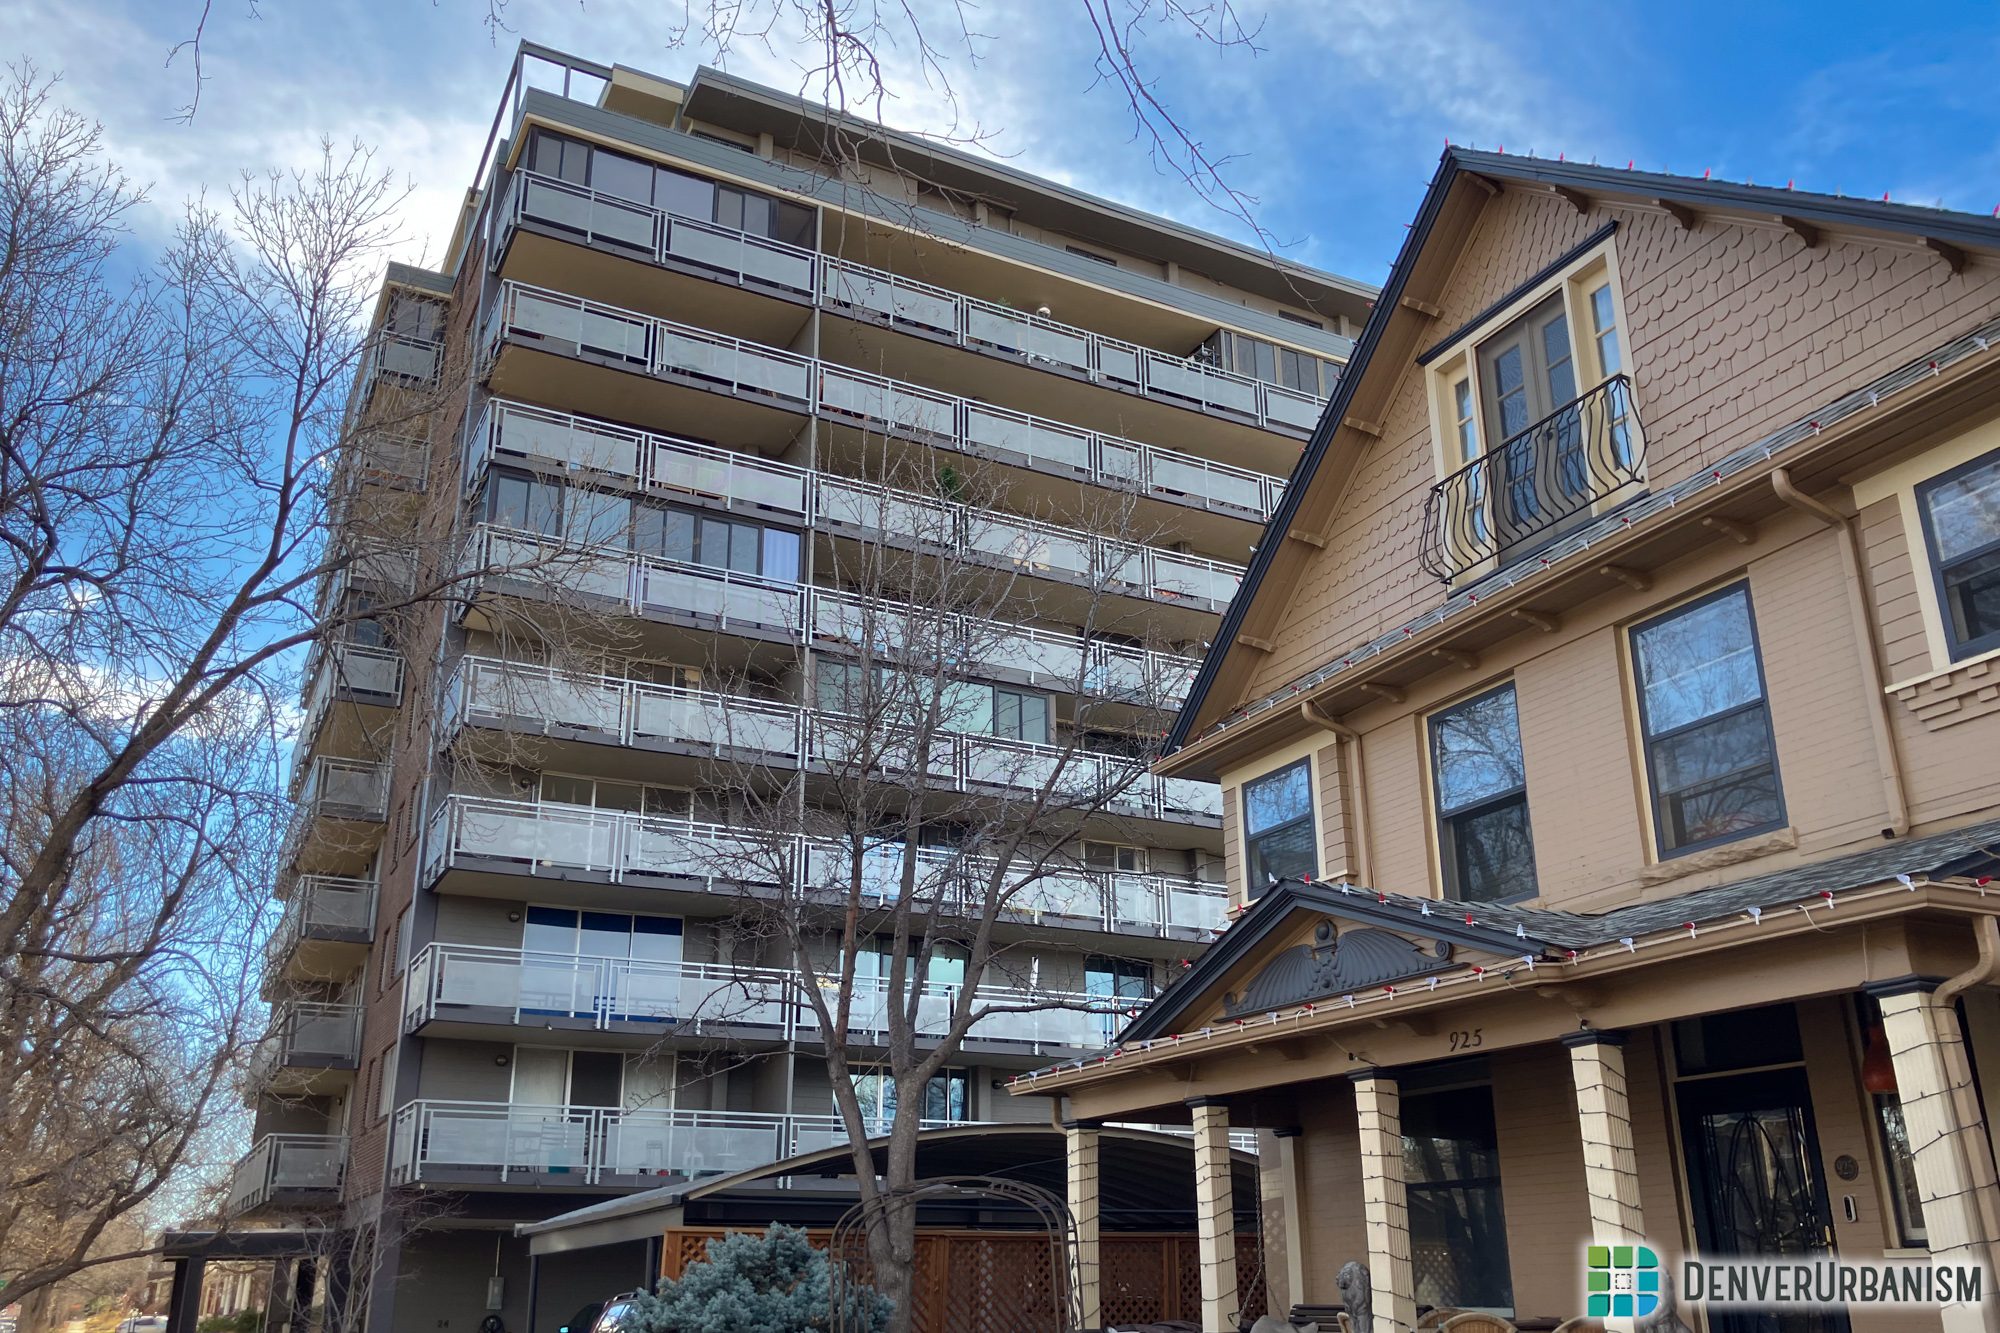
The 2022 population of the Golden Triangle was estimated to be 3,586 people, 1,300 more than in 2019. The median household income was $110,725, compared to the citywide median of $88,213. The median age of the neighborhood was 34 years old in 2022, basically the same as the citywide median of 34.9 years old. Only 3% of the neighborhood’s population was under the age of 18 in 2022, compared to 20% citywide. The 2020 Census counted 2,916 housing units in the neighborhood, and 2,238 homes were occupied as of 2022 estimates. Since the 2020 Census, the neighborhood has added 894 homes, with another 2,437 homes under construction, and 1,300 more proposed. We talked at work about how the new rental apartment towers being built will probably continue to attract young, well-paid, and childless households to the neighborhood, pushing this section of Downtown further away from the median Denver neighborhood’s statistics.

CT-20, known to us as the Golden Triangle, doesn’t emerge as superlative in Census data. Households there don’t have the highest median incomes: that honor goes to Hilltop in CT-43.03 at $250,000 per household. It doesn’t have the lowest number of children; CT-17.06, CT-70.91, CT-17.04, and CT-27.04 all had 0 population under the age of 18, according to the Census Bureau. Nor does the Golden Triangle have the highest number of households without cars: over 45% of households have no vehicle access in CT-8 and CT-26.04 in Sun Valley and North Capitol Hill respectively. The only superlative datum the Census Bureau collected on the Golden Triangle was the percentage of workers working from home in 2022: 44% of workers worked at home compared to 21% citywide, more than any other CT.
Though working from home is not the sexiest data point, digging deeper into Census data started to help me better understand some trends in Denver’s central and downtown neighborhoods. Census data also clearly differentiates the urban qualities in Denver’s central and downtown neighborhoods compared to outlying neighborhoods. In commuting mode-share, population density, household size and makeup, among other qualities, it’s clear that there are distinct behavioral and compositional edges to Greater Downtown neighborhoods, as DenverInfill called it in Summer of 2022. But of course, every neighborhood in Denver has a unique condition or set of behaviors amongst the residents. What follows is a brief analysis of the most “urban” parts of Denver, according to key metrics assessed by the Census Bureau, and then a pass at some quirks in outlying neighborhoods as illuminated by Census data. For the full data set, you’re welcome to peruse my annotated Google sheet where I sorted Census data as it made sense to me.

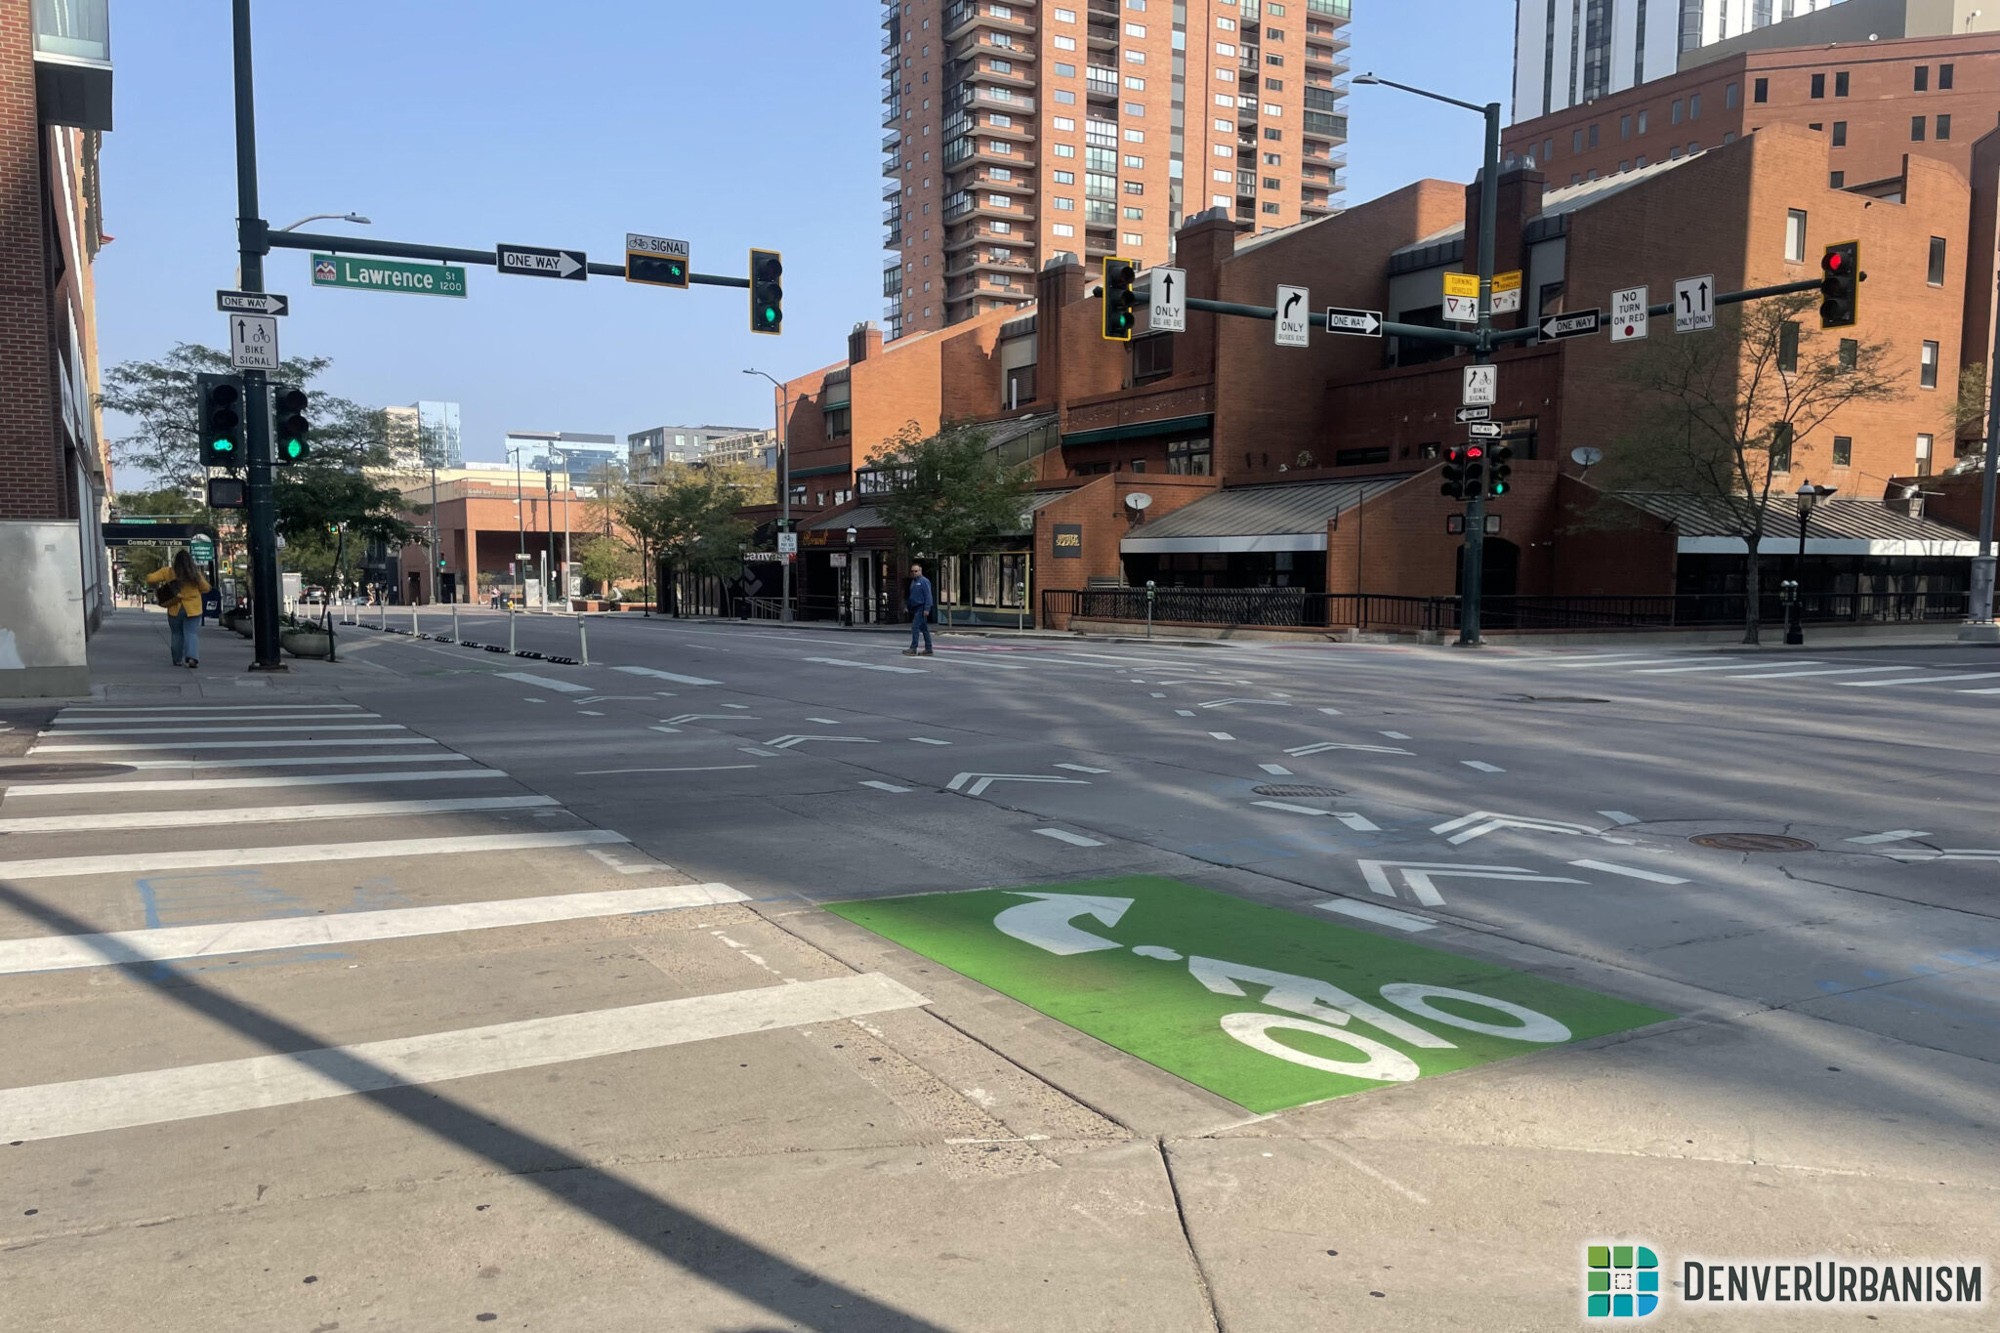
First, downtown and adjacent neighborhoods, organized by Census Tract. Across the city, 62.4% of workers drive to work. In Denver’s most urban CTs, a majority of residents walk, bike, take RTD, work from home, or use other means to get to work. A green box indicates the citywide lows: between 25-40% of workers drive (a car, truck, or van) to work. An orange oval indicates just under half of workers drive to work. Most all of these CTs with less than 50% of workers driving to work are walkable to downtown. The rest have access to frequent RTD service like a rail line or frequent bus. The CT with the lowest percentage of workers driving to work is CT-17.04, Lower Downtown, defined by 20th Street, Lawrence Street, Speer Boulevard, and Wynkoop Street. At the opposite extreme, CT-83.04 (northwest Montbello) sees 95.6% of workers drive to work, 75.8% of them driving alone.
As Dan Malouf said on this blog 11 years ago, “Density is a good thing for urbanism.” A green star indicates the rare three CTs with over 30,000 persons per square mile, Denver’s densest Census tracts. An orange asterisk indicates the CT has between 20,000-29,999 persons per square mile. The 2022 American Community Survey located the most densely populated CT in Downtown, CT-17.03 in Union Station. (Pretty impressive, considering that particular Union Station Census tract is half comprised of Commons Park.) The second- and third-most densely populated CTs in Denver were both in Capitol Hill, CTs 27.09 and 27.05, respectively. In a 2023 video, urbanist YouTube channel Oh the Urbanity judged 41,000 persons per square mile as “medium density urban.” Nothing in Denver approaches even that “medium” urban density. It remains to be seen how this wave of transit-oriented development will increase the density of certain CTs in future ACS data.

The two Census tracts with the highest share of workers walking to their job is not surprising at all, CT-17.07 in the Central Business District followed by CT-26.04 in Uptown. Despite sharing close access to downtown jobs and a proclivity for walking to work, these CTs have very different populations: CT-26.04 has both the second-lowest incomes and vehicles per household in the whole city, while CT-17.07 has four times the median household income with less than half the population density.
The two Census tracts with the highest share of workers taking transit to work in 2022 were CT-8, all of Sun Valley, followed by CT-50.03 at the edge of Washington Virginia Vale. Sun Valley is a superlative neighborhood in Denver, but not for the benefit of the neighborhood’s residents. CT-8 ranked #1 for the percent of the population in poverty, for unemployment, for lack of access to a personal vehicle; it has the lowest median age, lowest college graduation rate, lowest median household income, the lowest population of any Denver neighborhood, and consequently the lowest population density. We have already explained how drastically Sun Valley is changing; it will require years to see how Sun Valley benefits from the re-development of their public housing by the Denver Housing Authority, and we’ll be interested for residents to attest to what has improved or been disregarded. But thinking about transit, on some level, it makes sense that the frequency of using public transit to commute increases further away from downtown. As Census data gets further past the pandemic and more commuters choose to take RTD once again, it will be interesting to observe whether these two CTs are consistently in the top spots, or if these represent perhaps the two most transit-dependent workforces, illuminated by the 2022 ACS data.

The census tract with the highest share of workers biking surprised me, CT-43.07 at 18%, which is the northwest corner of Hale. This isn’t a quirk of 2022 data! In 2020 the ACS estimated that nearly a quarter of the workers in this CT biked to work, compared to 11% of the population that worked from home. The second-highest share of biking workers was in CT-27.09, the section of Capitol Hill around the old Whole Foods. In 2022, neither of these Census tracts had any high-comfort bike infrastructure, nor did they see new high-comfort bikeways proposed since then. (If you have an explanation for these rates of bike commuting, please share it in the comments!) 2022-2023 saw a massive jump in the number of high-comfort bikeways across Denver as Mayor Michael Hancock looked to deliver a promise of 125 new miles of bike lanes to Denver. As any regular cyclist on Denver’s streets would say right now, it does feel that the city has turned a corner since 2022, and the number of e-bikes and families biking around town blows me away. In future ACS data, we will eagerly look for changes in cycling to work across the city.
Finally, as a cisgender gay man who moved to Colorado because it was clearly a state supportive of equal rights for all people, regardless of gender-identity, expression, or sexuality, I thought it would be interesting to find the Census tracts with the highest percentage of same-sex partnered households. (This statistic is tracked by the Census Bureau, as opposed to the broader population of self-identified queer Denverites.) The results were completely unsurprising. The pink triangles identify any CT where >2% of the population was a same-sex partnered individual. The highest CT by same-sex partnered household was CT-32.05, which includes Cheesman Park, and all of the CTs with >2% of the population as same-sex partnered could be found between Broadway and York Streets, between Speer and E. 26th Avenue. It used to be said that Pearl Street was the backbone of Denver’s gay-borhood; the data suggests that Downing Street and E. Colfax Avenue better represent the axes of the community.

Finding or making community happens between people, in a specific place, at a specific time. If your neighborhood was not mentioned today, it doesn’t mean there is no urban fabric or urban characteristics to that place. River North is completely left out of this post; so goes the data. There is no one best neighborhood in Denver, nor a neighborhood that typifies the problems in the city. But for the further understanding of what urbanism in Denver means to the people living here, it’s helpful to understand where those most urban places are, and what people do there that characterize “urban.” Maybe then we can better understand why our neighbors live the way they do, and how small changes in where we live can mean big changes in our daily lives.
*Editor’s note: Post was edited to remove the erroneous claim that the most densely populated Census tract was in southwest Denver. Thank you to @dontmindme85 on X (formerly known as Twitter) for challenging the dataset.


“The second-highest share of biking workers was in CT-27.09, the section of Capital Hill around the old Whole Foods. In 2022, neither of these Census tracts had any high-comfort bike infrastructure, nor did they see new high-comfort bikeways proposed since then. (If you have an explanation for these rates of bike commuting, please share it in the comments!)”
I previously lived in 27.05, just beside 27.09, and can attest to the ease of biking to work in the downtown/LoDo districts. That area is just over 2 miles from Union Station, so it’s a bit too far to walk the commute, but short enough that a quick 10-15 minute bike ride is very achievable. Although there is not a “high-comfort” bike infra in the neighborhood, the bike lane on 11th is a great amenity, and cutting past the Capitol provides a low-vehicle route into the downtown core. Residents in this area can also divert down 11th to the Cherry Creek Trail and take that directly into LoDo if they prefer the trail. I can also venture a guess that a notable share of residents in this neighborhood work locally, either in the commercial areas on 13th, 11th, 12th (east of Cheesman), or Cherry Creek North, all areas which are walkable, but especially bikeable, from this area of Cap Hill.