Last week’s post about Colorado’s densest neighborhoods showed where density is clustered in Denver and other Front Range cities. Now let’s look at the densest spots in the core areas of other large cities around the US.
This post shows the census tract density of the central county (only) in each of America’s 20 largest Urban areas, in both 2000 and 2010. The list is in order of size, so New York is first, LA second, and Denver 18th.
Note that the scale on these maps is different than on the Colorado ones from last week, since the scale of density in cities nationwide is more broad than just within Colorado. All the maps in this thread do show the same scale compared to each other.
| 1. New York: America’s biggest city breaks the scale. While others on this list might have a few neighborhoods in the top density category, which on these maps is 40,000 ppsm and higher, New York is covered end to end. It’s one of only 4 cities with any tracts above 100,000 ppsm. Its peak is 200,000 ppsm. | |
2000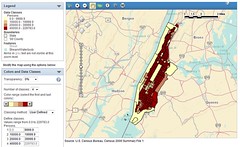 | 2010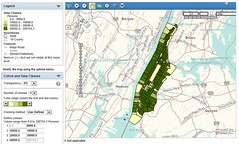 |
| 2. Los Angeles: Despite its reputation for sprawl, LA compares favorably to the densest cities after New York. Its peak density of 94,000 ppsm is 4 times denser than Denver’s peak of 23,000 ppsm. | |
2000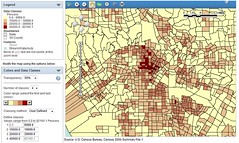 | 2010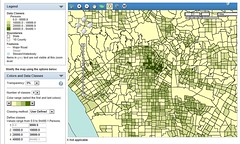 |
| 3. Chicago: Home to probably the single-densest census tract in America, a 508,000 ppsm anomaly that’s just a single high rise, and is so small it’s not visible at normal scale. Besides that tract, Chicago tops around at about the same level as LA. | |
2000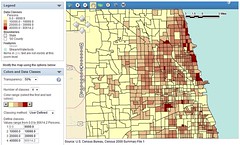 | 2010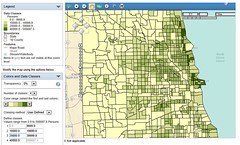 |
| 4. Miami: Thanks to more narrowly-drawn census tracts along its high-rise coast, Miami’s peak density shot up from 38,000 ppsm in 2000 to 77,000 ppsm in 2010, but the actual change wasn’t as significant on the ground. | |
2000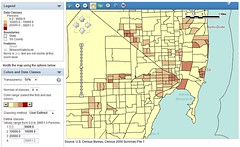 | 2010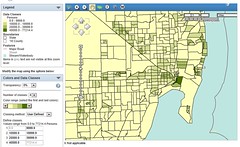 |
| 5. Philadelphia: Philadelphia’s peak rose from 54,000 ppsm in 2000 to 64,000 in 2010. | |
2000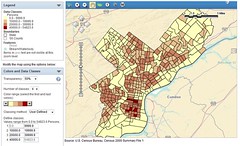 | 2010 |
| 6. Dallas: Despite a lot of regional growth, Dallas’ density dropped significantly. It has fewer dense tracts in 2010 than in 2000, and its peak is down to 44,000 ppsm from 57,000 ppsm. | |
2000 | 2010 |
| 7. Houston: Unlike Dallas, Houston appears to be densifying. Oddly, its densest area, with 55,000 ppsm, is not the core. | |
2000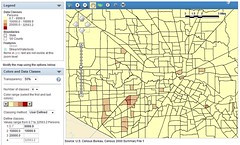 | 2010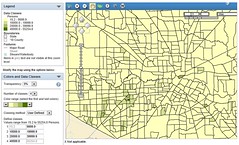 |
| 8. Washington (with Arlington & Alexandria): Washington’s peak density increased from 57,000 ppsm to 66,000 ppsm. Note that this map includes 2 jurisdictions in addition to the central county, unlike all others on this list. | |
2000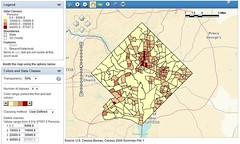 | 2010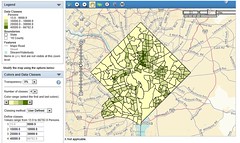 |
| 9. Atlanta: Not only is Atlanta shockingly sparse, its densest tract fell from 41,000 ppsm in 2000 to just 21,000 ppsm in 2010. The explanation? A downtown public housing complex was demolished, erasing the population of the densest 2000 tract. | |
2000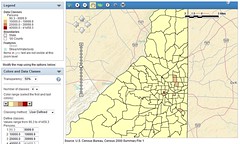 | 2010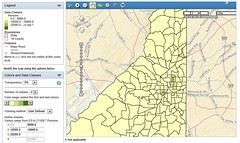 |
| 10. Boston: One of only 4 cities with a tract above 100,000, Boston has a single tract that reaches 110,000 ppsm. | |
2000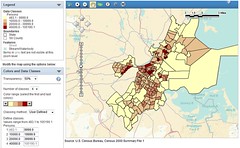 | 2010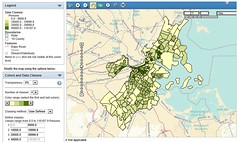 |
| 11. Detroit: Detroit’s peak density of 18,000 ppsm is about the same as in 2000, but the number of mid-density tracts above 10,000 ppsm declined significantly as the city continued to empty. | |
2000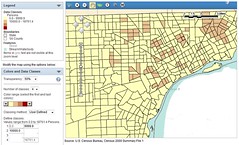 | 2010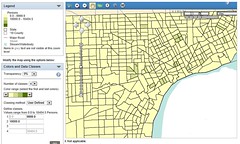 |
| 12. Phoenix: Phoenix tops out at 23,000 ppsm, the same as central Denver. But unlike Denver, Phoenix is strongly de-centralized. It has no visible downtown core, and its 23,000 ppsm tract is in the suburbs. | |
2000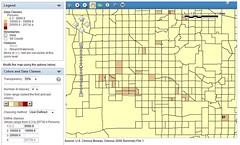 | 2010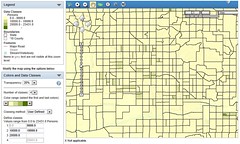 |
| 13. San Francisco: San Francisco has more tracts above 100,000 ppsm than any city except New York. It tops out at 161,000 ppsm. | |
2000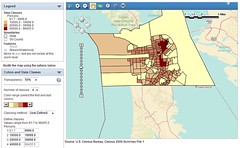 | 2010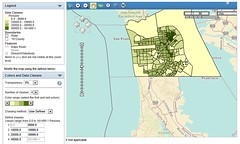 |
| 14. Seattle: With a peak of 51,000 ppsm and a small but significant core, Seattle is smaller than the other big coastal cities on this list, but still strongly centralized and quite dense. | |
2000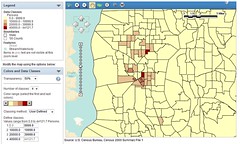 | 2010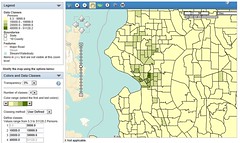 |
| 15. San Diego: While downtown San Diego densified compared to 2000, and its 50,000 ppsm peak is higher, some of its other denser neighborhoods are sparser in 2010. The densest area is Mission Valley instead of the core. | |
2000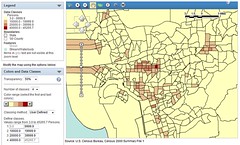 | 2010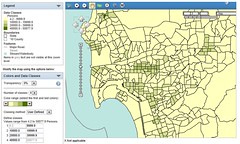 |
| 16. Minneapolis: Of all the cities on this list, Minneapolis looks the most similar to Denver. Its distinct core of moderate density neighborhoods topped out at 25,000 ppsm in both 2000 and 2010. | |
2000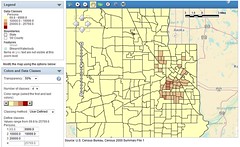 | 2010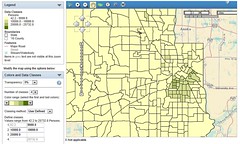 |
| 17. Tampa: By far the sparsest city on this list, Tampa’s peak of 13,000 ppsm means it has no tracts in the 3rd or 4th categories, and precious few crack even into the 2nd. Boulder and Aurora are denser, Lakewood is about the same. | |
2000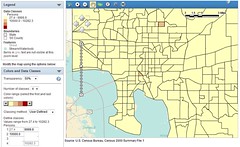 | 2010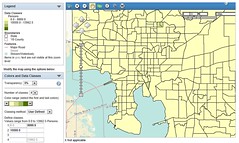 |
| 18. Denver: Denver is like a hybrid of sparse sunbelt cities and dense coastal ones. Like coastal cities, Denver has a noticeable core of dense neighborhoods near downtown. But like the sunbelt ones, Denver’s densest spot is in a suburban area, a 31,000 ppsm tract in Glendale. Denver’s urban peak of 23,000 ppsm is slightly lower than it was in 2000, when Capitol Hill was 26,000 ppsm. The drop is most likely due to demographic changes, as more singles but fewer families live in the same places. Densities increased in downtown and LoDo, but not yet enough to be visible at this scale. | |
2000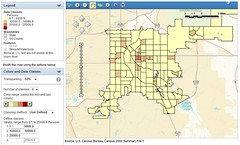 | 2010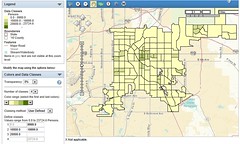 |
| 19. Baltimore: Baltimore’s lone tract in the densest category is an impressive 86,000 ppsm, but that tract is down from a whopping 176,000 ppsm in 2000. Why such variation, and why 1 tract so much denser than all the others? That one extreme tract is a prison. | |
2000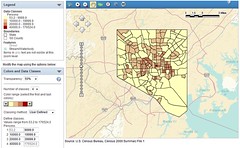 | 2010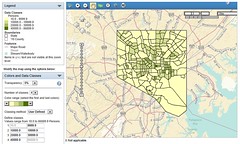 |
| 20. Saint Louis: Saint Louis’ losses have been less drastic than Detroit’s, but they still hurt. Its peak is down to a Tampa-like 13,000 ppsm, from 15,000 ppsm in 2000. | |
2000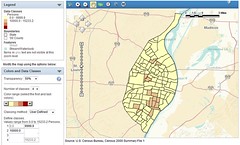 | 2010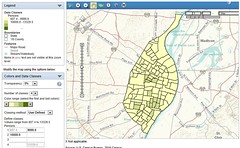 |
Want to see more? You can make maps like these for any county in the United States, using census.gov. Here are instructions.

“Denver’s densest spot is in a suburban area, a 31,000 ppsm tract in Glendale.”
While Glendale is not in the City and County of Denver, I don’t think it is fair to characterize it as “suburban” given that fact that it is entirely surrounded by the City and County of Denver and hence topologically is actually more central than the City and County of Denver itself.
I don’t understand the ordering of these cities. Miami is not the 4th largest city in America nor does it appear to be the 4th densest. I’m confused.
Miami is the 4th largest urban area. Basically, urban areas are places with continuous development.
Here is the wikipedia entry. The actual definition, provided and measured by the US Census, is geographically connected census tracts with a population density of at least 1,000 people per square mile. The point of urban areas is to provide a uniform definition of “city” that’s standardized across the whole country, and doesn’t rely on political boundaries.
The problem with political boundaries is that they vary so much from region to region, just based on annexation history. Some cities annexed vast parts of their suburbs, while others are barely more than downtown. So if you want to compare cities across the country and want it to be statistically valid, you need a measure that gives you an apples-to-apples comparison. UAs do that, more or less.
Even so, there are some quirks with the urban area standard, mainly in places where multiple urban areas bleed together, and the standard says they should be combined into one, but they’re kept separate. That’s why San Francisco is so low on the list; half of its suburbs are counted as part of the San Jose urban area, which is independent. But still, it’s better than city boundaries, and arguably as good or better than metropolitan areas (which are a whole different standard based on county borders and commuting).